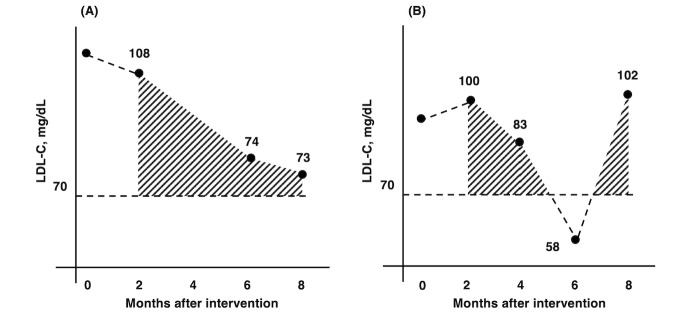
Fig.1. Schematic diagram of the calculation of areas over the curve.
To quantify the degrees of intensity and maintenance of LDL-C-lowering therapy during the six-month period from two to eight months after percutaneous coronary intervention (PCI), excluding the baseline value, we plotted the available LDL-C values from two to eight months after PCI. We then calculated the total trapezoidal area under these linearly connected points above a threshold. LDL-C = low-density lipoprotein cholesterol.

