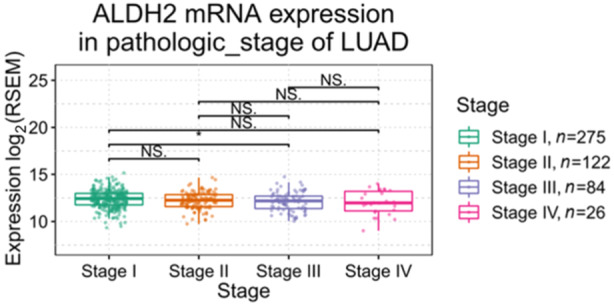
Figure 3.

ALDH2 expression in different stages of lung adenocarcinoma (LUAD). The pathological stage plot created by using the Gene Set Cancer Analysis platform on TCGA data to compare ALDH2 expression in various stages of LUAD. TCGA, The Cancer Genome Atlas. The asterisk (*) indicates a statistically significant difference between the indicated groups (p ≤ 0.05). NS. indicates not significant.
