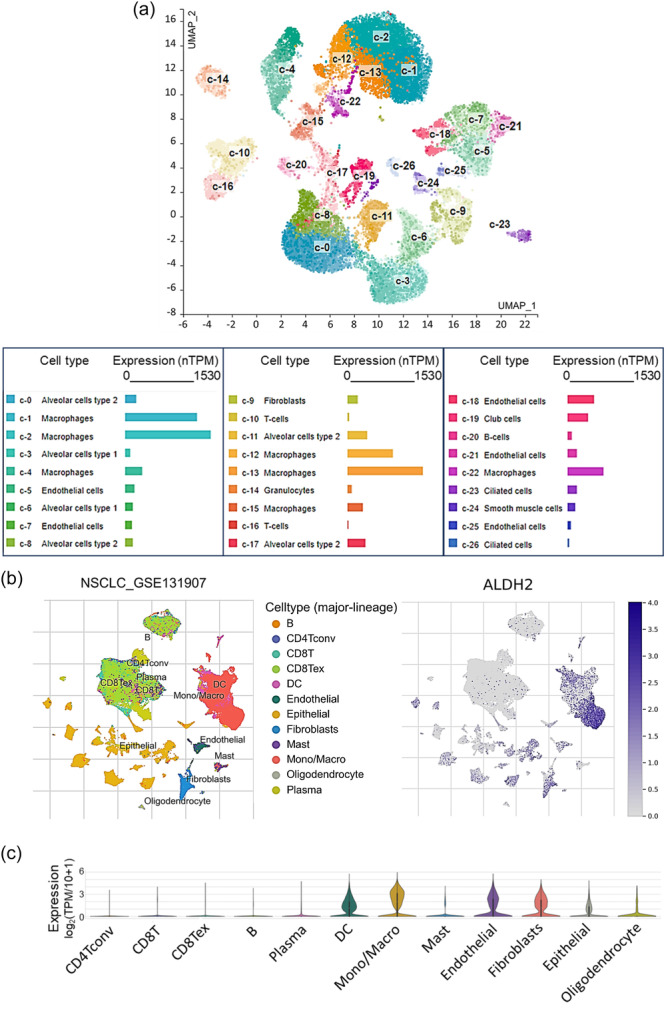
Figure 9.

ALDH2 expression of at the single‐cell level in the tumor microenvironment. (a) Uniform manifold approximation and projection (UMAP) plot showing single‐cell RNA‐seq analysis in healthy lung tissue according to the HPA platform. Expression levels indicated in normalized transcripts per million (range 0–1550). (b) UMAP and (c) violin plots showing the distribution of ALDH2 expression in different cell types in the single‐cell transcriptomic non‐small cell lung cancer data set NSCLC_GSE131907. Analysis was performed with the TISCH2 platform.
