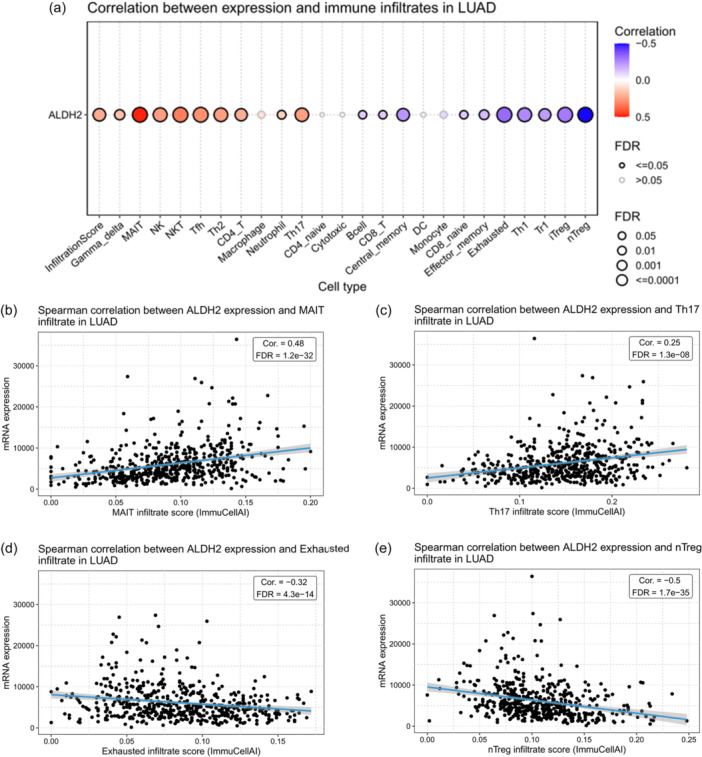
Figure 10.

Correlation analysis between ALDH2 and immune infiltrate in lung adenocarcinoma. (a) Correlation between ALDH2 expression and immune cell infiltration in the tumor microenvironment of LUAD. The color indicated Spearman's correlation coefficient and the circle size represented the false discovery rate (FDR) value; the smaller the value, the larger the circle. Graphs showing the Spearman correlation between ALDH2 expression and infiltration scores of (b) mucosal‐associated invariant T (MAIT) cells, (c) T helper 17 (Th17) cells, (d) exhausted T cell, and (e) naturally occurring regulatory T (nTreg) cells. Analysis was performed using the GSCA platform. GSCA, Gene Set Cancer Analysis; LUAD, lung adenocarcinoma.
