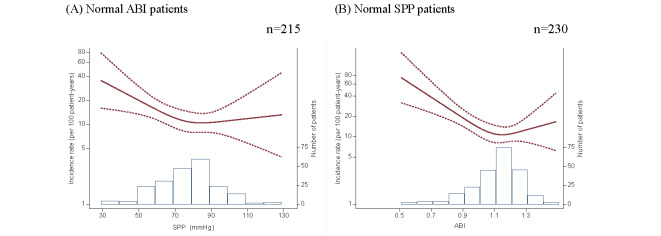
Supplemental Fig.3. The incidence rate of the composite event against SPP and ABI levels in patients with normal ABI and SPP.
Incidence rates were analyzed via Poisson regression adjusted for eight risk factors, as shown in Table 2, and presented using a restricted cubic spline model. The dashed lines show 95% CIs. The number of patients in the histogram is presented in the second axis. These rates were explored across SPP values in patients with a normal ABI (A) and across ABI values in patients with a normal SPP (B). Lower SPP and ABI levels were associated with a higher risk, even if ABI or SPP was within the normal range.
SPP, skin perfusion pressure; ABI, ankle-brachial index; CI, confidence interval

