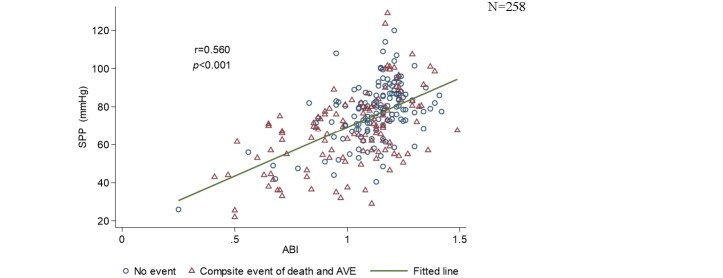
Supplemental Fig.1. Correlation between SPP and ABI values.
The scatterplot shows the relationship between SPP and ABI values. Pearson's correlation coefficient was calculated to be 0.56 (p<0.001). Blue circles represent patients who did not experience any composite event of death and AVE, whereas red triangles represent those who did. We found that the blue circles were concentrated where both SPP and ABI were high.
SPP, skin perfusion pressure; ABI, ankle-brachial index; AVE, atherosclerotic vascular event.

