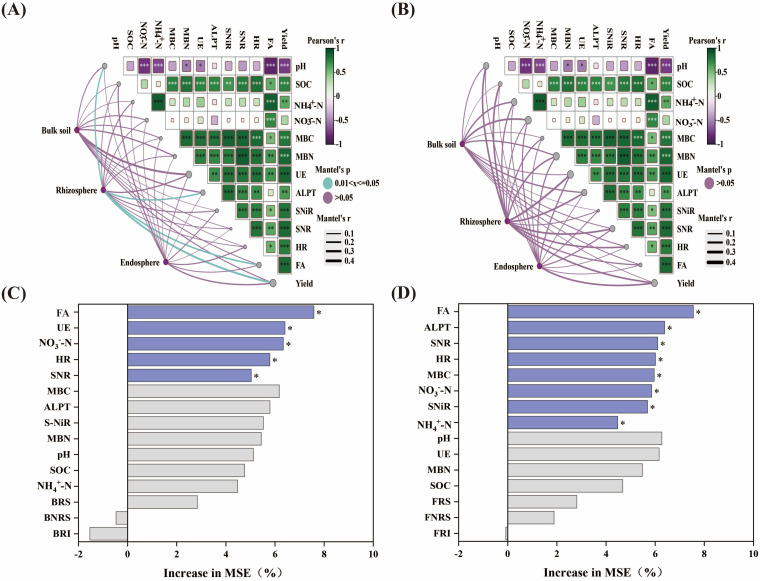
Figure 5.
Mantel tests analyzed soil properties and the relationship between bacterial (A) and fungal (B) diversity and yield. The width of the line represents the partial Mantel statistic, and the color of the line represents the statistical significance based on 999 permutations. Pairwise correlations of environmental factors were represented by the Pearson correlation coefficient of color gradient. Random forests determine the effects of soil properties, bacterial (C), and fungal (D) diversity on yield. * indicates p < 0.05. FA, Fertilizing amount; BNRS, Bulk soil bacteria; BRS, Rhizosphere bacteria; BRI, Endosphere bacteria; FNRS, Bulk soil fungi; FRS, Rhizosphere fungi; FRI, Endosphere fungi. ** means P<0.01; *** means P<0.001.

