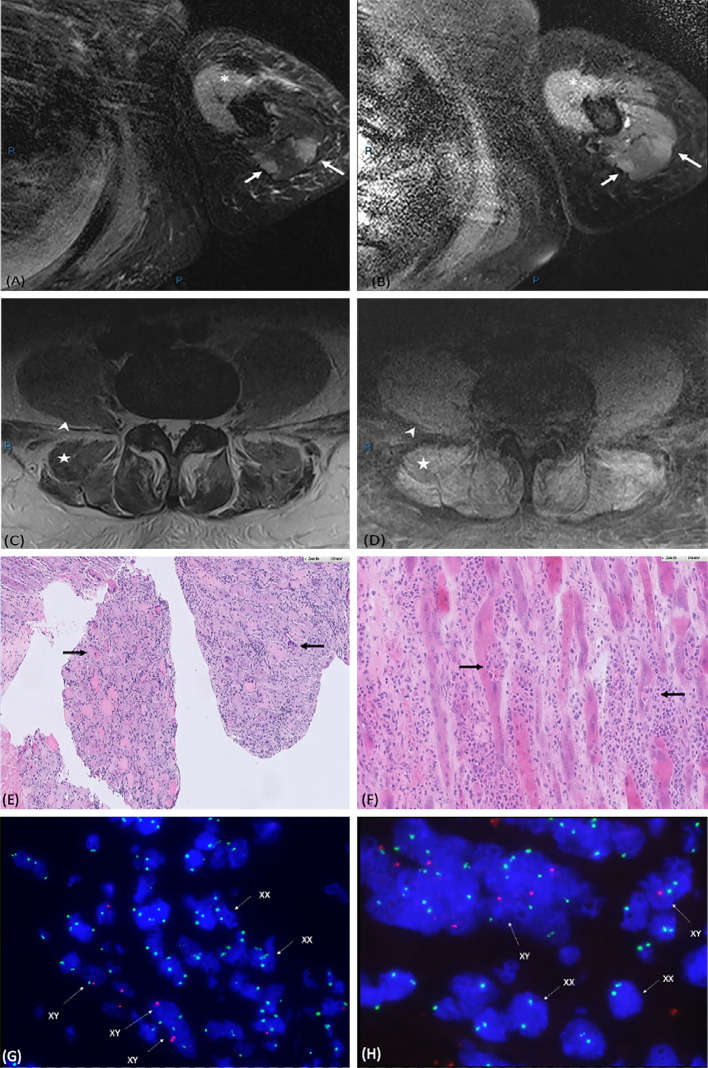
Figure 1.
(A) (B) Axial T2 turbo spine echo (TSE) fat saturation and Axial T1 (TSE) post gadolinium fat saturation images of the left upper arm
There is diffuse hyperintense T2-weighted signal noted in the biceps brachii muscle (*) and patchy hyperintense T2-weighted signal in the triceps muscle involving the long head and the lateral head (arrows) compatible with oedema. There is enhancement of the corresponding areas in the post contrast images.
(C) (D) Axial T2 turbo spine echo (TSE) fat saturation and Axial T1 (TSE) post gadolinium fat saturation images of the lumbar spine at L5
There is patchy hyperintense T2-weighted signal in the right erector spinae muscles (star) and the psoas muscles (arrowhead). Involvement is fairly symmetrical with similar changes on the left side and there is enhancement of the corresponding areas in the post contrast images.
(E) Extensive infiltration of entire muscle fascicle by lymphocytes
A number of necrotic muscle fibers are seen with internalized myocyte nuclei (arrows).
(F) Higher power of image (E)
Higher power of necrotic muscle fibers shows them in the process of being phagocytosed by histiocytes (arrows).
(G) (H) Fluorescence in-situ hybridization (FISH) analysis of sex chromosome (XY) on muscle biopsy specimen at 600× and 1,000× magnification respectively
Chromosome enumeration probe (CEP) X in green and Y in red

