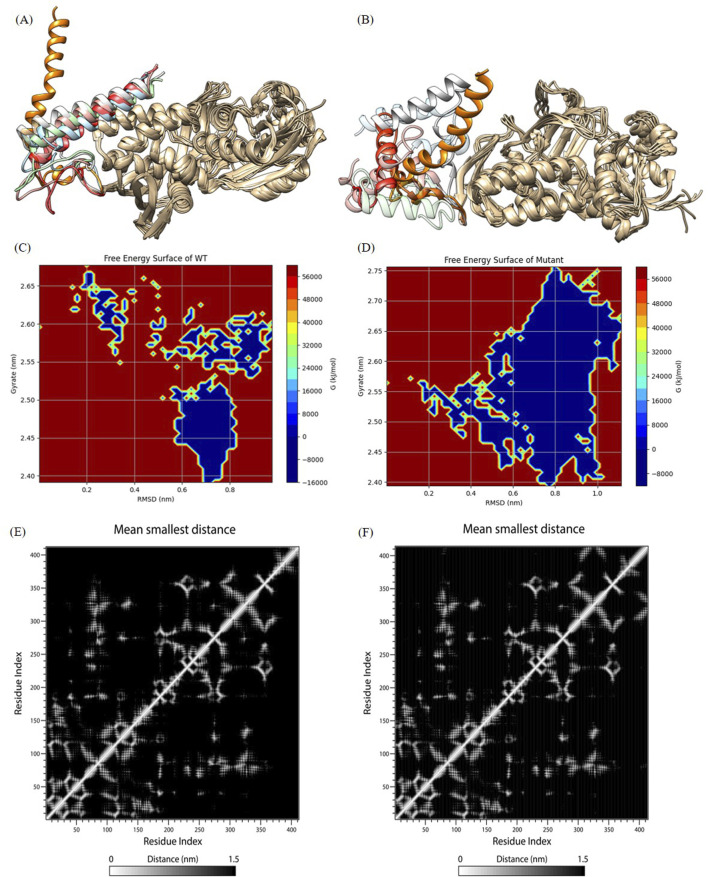
FIGURE 5.
Analysis of molecular dynamics simulation results. (A) and (B) show wild-type and mutant initial structures and protein structures at 20 ns, 40 ns, 60 ns, 80 ns, 100 ns during simulation. The C-terminal helices at 20 ns, 40 ns, 60 ns, 80 ns, and 100 ns are labeled in orange, light blue, red, pink, cyan, and gray, respectively. (C) and (D) The FES analysis of the wild-type and the mutant structures. (E) and (F) Contact Matrix Diagram of the wild-type and the mutant structures.

