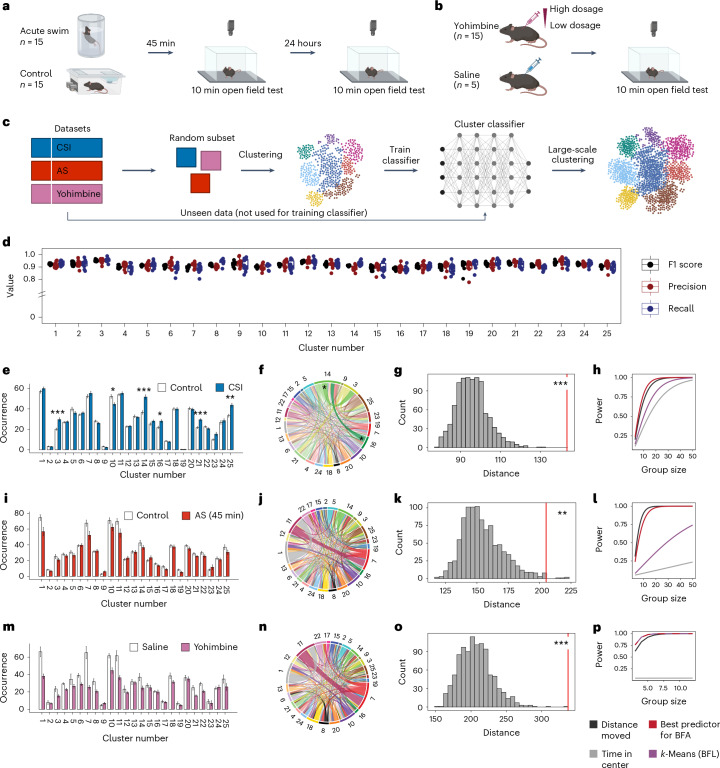
Fig. 2. Cluster stabilization enables comparisons across experiments.
a,b, A schematic of the experimental design for OFT after acute swim stress (AS) (a) or after yohimbine injections (b). c, Clustering across large datasets. d, Classifier performance on 10-fold cross-validation for each cluster. e, Quantification of cluster occurrences in CSI (n = 30, controls: n = 29; two-tailed t-tests with multiple testing correction). f, Absolute differences in behavioral flow in control versus CSI. For each cluster, the absolute difference in the observed number of transitions between groups is plotted. g, BFA reveals a treatment effect for CSI (one-tailed z-test, percentile 99.9, z = 6.02, P = 8.63 × 10⁻¹⁰, d = 0.92). h, Power analysis in CSI. i, Cluster occurrences in AS (45 min) (n = 15, controls: n = 15; two-tailed t-tests with multiple testing correction). j, The absolute difference in behavioral flow in control versus AS (45 min). k, BFA reveals a treatment effect for AS at 45 min (one-tailed z-test, percentile 99.4, z = 3.09, P = 1.01 × 10⁻³, d = 0.53). l, Power analysis in AS. m, Cluster occurrences in yohimbine (n = 15, controls: n = 5; two-tailed t-tests with multiple testing correction). n, The absolute difference in behavioral flow in saline versus yohimbine. o, BFA reveals a treatment effect for yohimbine (one-tailed z-test, percentile 99.8, z = 5.56, P = 1.38 × 10⁻⁸, d = 2.91). p, Analysis of cluster transitions shows higher power in detecting treatment effects for yohimbine. P values and adjusted P values are denoted as *<0.05, **<0.01 and ***<0.001. The error bars in the bar plots denote mean ± s.e.m.

