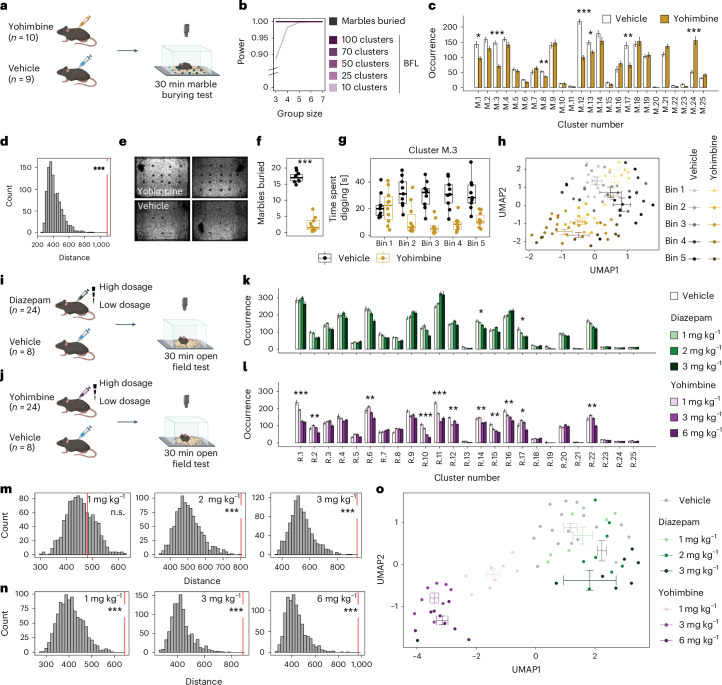
Fig. 6. BFA and BFF are transferable to other setups.
a, A schematic showing the experimental design for the marble burying test (MBT) after yohimbine or vehicle injection. b, Power analysis comparing different numbers of k-means clusters with the number of ‘marbles buried’ for MBT. c, Cluster occurrences in MBT (yohimbine: n = 10, vehicle: n = 9; two-tailed t-tests with multiple testing correction). d, BFA reveals a treatment effect of yohimbine (one-tailed z-test, percentile 99.9, z = 7.1, P = 6.21 × 10⁻¹³, d = 6.57) in MBT. e, Examples of final frames showing marbles buried after yohimbine (top) versus vehicle injection (bottom). f, Marbles buried differ significantly (two-tailed t-test, t(16) = 16.2, P = 2.03 × 10⁻¹¹) after vehicle (n = 9) versus yohimbine (n = 10) injection. g, Time spent in cluster M.3 (digging cluster) evolves differently over time for mice after vehicle (n = 9) or yohimbine (n = 10) injection. Each bin represents 6 min. h, BFF shows change in behavior profile over time for yohimbine (n = 10) and vehicle (n = 9). i, A schematic showing the experimental design for OFT after diazepam or vehicle administration. j, A schematic showing the experimental design for OFT after yohimbine or vehicle injection in another laboratory using a different OFT setup. k,l, Cluster occurrence in diazepam (n = 24, vehicle: n = 8) (k) or in yohimbine (n = 24, vehicle: n = 8; one-way ANOVA with multiple testing correction) (l). m, BFA shows treatment effects after higher doses of diazepam (one-tailed z-test, 1 mg kg−1: percentile 68.93, z = 0.5, P = 3.08 × 10⁻¹; 2 mg kg−1: percentile 99.9, z = 4.14, P = 1.76 × 10⁻⁵, d = 2.72; 3 mg kg−1: percentile 99.9, z = 4.91, P = 4.64 × 10⁻⁷, d = 4.2). n, BFA reveals behavioral changes after different doses of yohimbine injections (one-tailed z-test, 1 mg kg−1: percentile 99.9, z = 4.44, P = 4.52 × 10⁻⁶, d = 4.32; 3 mg kg−1: percentile 99.9, z = 6.1, P = 5.27 × 10⁻¹⁰, d = 6.12; 6 mg kg−1: percentile 99.9, z = 6.37, P = 9.60 × 10⁻¹¹, d = 6.33). o, BFF separates the different doses of diazepam (n = 24) and yohimbine (n = 24) administrations from vehicle injections (combined: n = 16). P values and adjusted P values are denoted as *<0.05, **<0.01 and ***<0.001. The error bars in the bar plots denote mean ± s.e.m. For box plots, the center line denotes the median value, while the bounding box delineates the 25th to 75th percentiles. The whiskers represent 1.5 times the interquartile range from the lower and upper bounds of the box.

