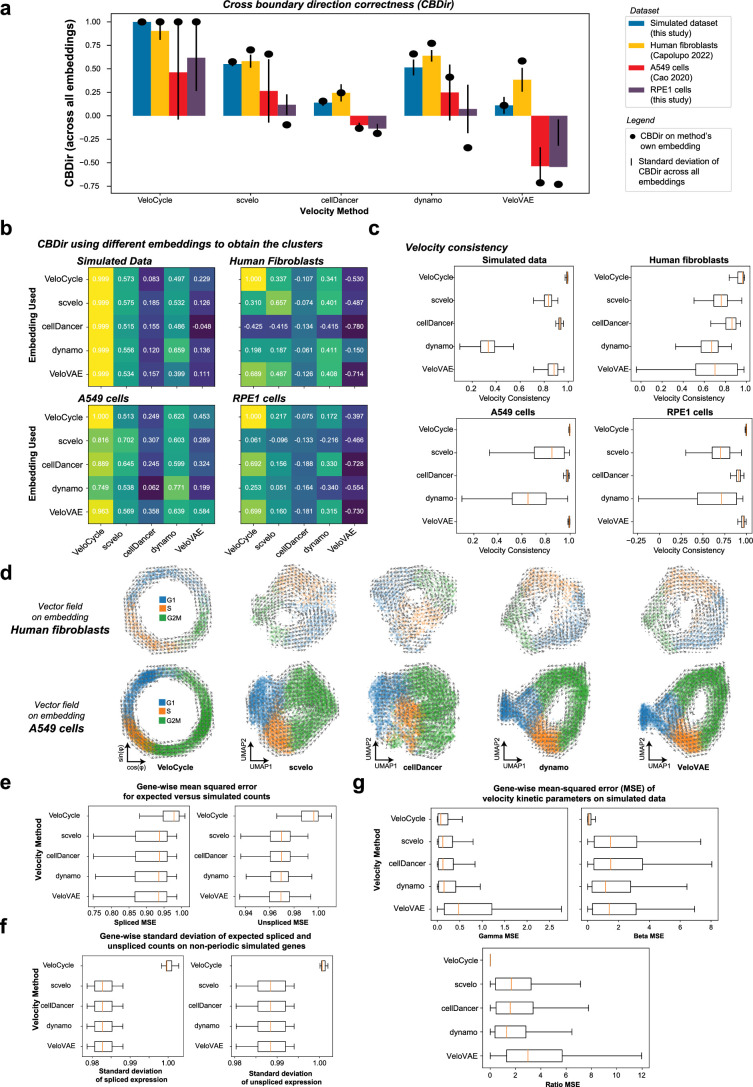
Extended Data Fig. 6. Benchmarking VeloCycle against numerous methods, metrics, and datasets.
(a) Bar plots of mean cross-boundary direction correctness (CBDir)6 computed on four datasets with five velocity methods. The CBDir score was computed for clusters obtained on each method’s embedding (see Methods 8.3). The black dot represents the score calculated using that specific method’s embedding, whereas the black line indicates the standard deviation across scores computed across all five embeddings and cluster annotations. (b) Heatmaps of the CBDir scores computed pairwise for each method using cluster relationships defined on each embedding, for all four datasets. (c) Box plot of cell-wise velocity consistency score21 (see Methods 8.4) computed on the same datasets and methods as in (a-b). (d) Low-dimensional embedding plots with grid-wise velocity vector fields computed for on fibroblasts (top) and A549 cells (bottom). Cells are colored by categorical phase to enable visual inspection of vector field direction correctness. (e) Box plots of the spliced (left) and unspliced (right) gene-wise mean squared error (MSE) obtained between expected un/spliced counts and simulated GT. (f) Box plots of gene-wise standard deviation of expected spliced (left) and unspliced (right) expression estimated. (g) Box plots of gene-wise MSE for the velocity kinetic parameters (logγg, logβg, kinetic ratio) compared to the simulated GT. For box plots in (c), (e), (f), and (g), boundaries are defined by the interquartile range (IQR), and whiskers extend each box by 1.5x the IQR.

