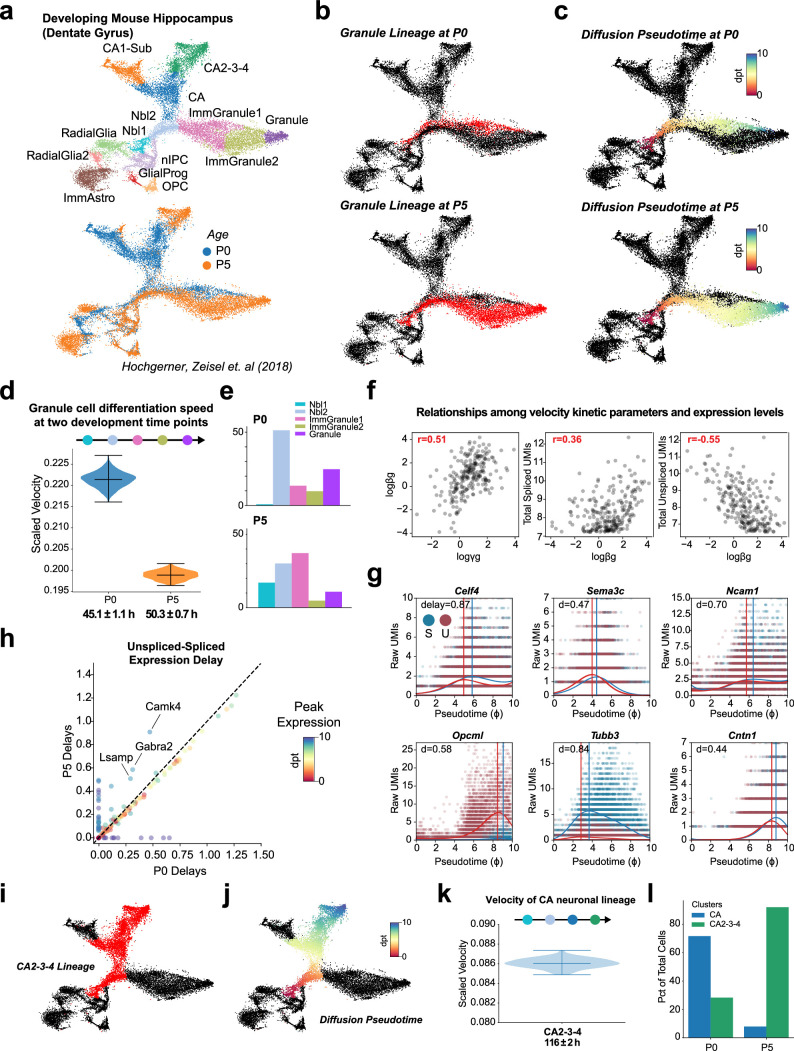
Extended Data Fig. 9. Manifold-constrained velocity analysis across cell types and developmental stages in the dentate gyrus.
(a) UMAP of mouse dentate gyrus64, colored by published cell types (top) and postnatal time point (bottom). (b) UMAP in (a), colored by selected data subsets (red) used to estimate 1D interval velocity of the granule cell differentiation lineage (Nbl1, Nbl2, ImmGranule1, ImmGranule2, Granule) at P0 and P5 time points. (c) UMAP of data subsets in (b), colored by the diffusion pseudotime applied as the low-dimensional manifold during velocity inference. (d) Violin plots of the posterior estimates obtained on the entire granule cell differentiation lineage. (e) Bar plots of cell type proportions in the granule lineage at P0 and P5 relative to the total number of cells. (f) Scatter-plot of the relationships between kinetic parameters and total un/spliced counts in cells from (d). Pearson’s correlation coefficients are indicated in red. (g) Scatter-plots of three selected genes, illustrating the estimated expected spliced (blue dashed line; ES) and unspliced (red dashed line; EU) levels along granule cell differentiation (d) compared to measured spliced (blue; S) and unspliced (red; U) counts. Peak un/spliced delay is indicated by vertical lines and the value at the top left (delay). (h) Scatter-plot of mean un/spliced expression delay for 237 shared genes during granule cell differentiation between P0 and P5. Gene dots are colored by manifold time (pseudotime) at peak expression. (i) UMAP colored by selected data subsets (red) used to estimate RNA velocity of the CA differentiation lineage (Nbl1, Nbl2, CA, CA2-3-4). (j) UMAP of lineage in (i), colored by diffusion pseudotime. (k) Violin plot of the posterior estimate obtained on the CA2-3-4 cell differentiation lineage using both P0 and P5 cells. (l) Bar plots of cell type proportions in the CA and CA2-3-4 clusters relative to the total number of cells at each time point. 200 posterior samples were used in (d) and (k); the black horizontal lines indicate the 5th, 50th, and 95th percentiles. An estimate of total differentiation process duration is indicated in black at the bottom of the x-axis.

