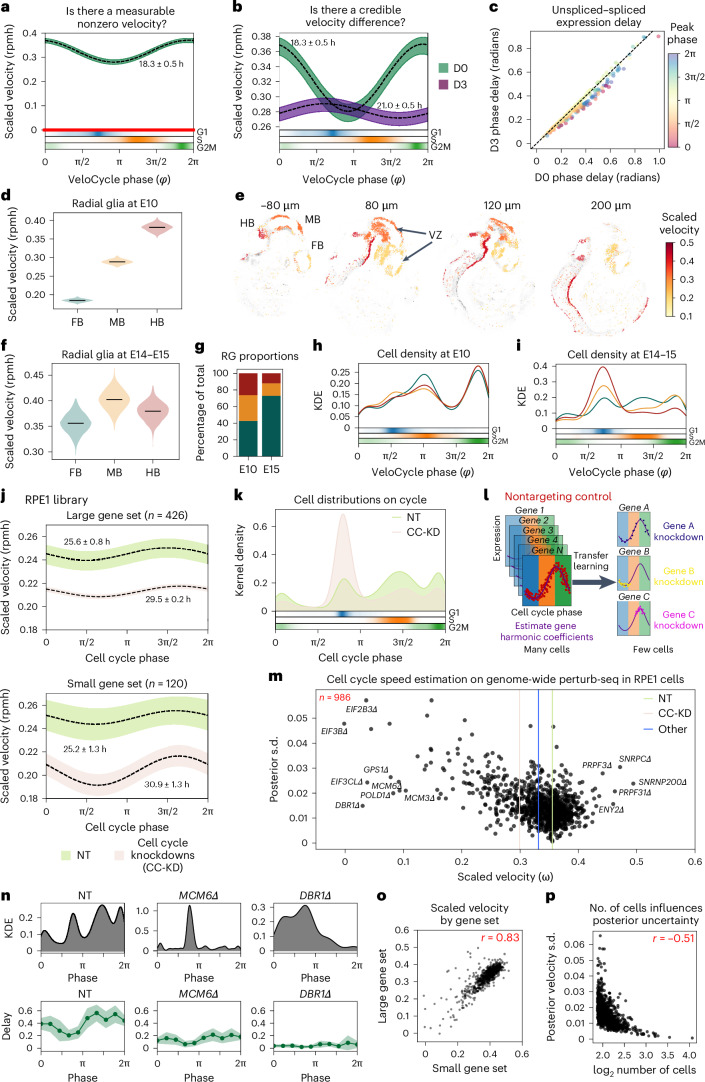
Fig. 6. Statistical velocity inference across diverse biological contexts and with transfer learning in genome-wide perturbation screens.
a, Posterior estimate plot of scaled velocity in PC9 lung adenocarcinoma cells46 (D0) compared to a zero-velocity control (red). b, Posterior estimate plot of scaled velocity before (D0) and after (D3) erlotinib treatment. Areas where intervals do not overlap indicate statistically significant velocity differences. Bottom: categorical phase assignment probabilities. c, Scatterplot of mean unspliced–spliced expression delay for 273 genes between D0 and D3 samples. Gene dots are colored by peak expression phase. d, Violin plots of scaled velocity estimates obtained for mouse FB, MB and HB RG progenitors52 at developmental stage E10. e, Spatial projection of single-cell clusters using BoneFight52 onto four sections of a reference E11 embryo profiled with HybISS, colored by velocity estimates. Regional domains (FB, MB and HB) and the ventricular zone (VZ) are labeled accordingly. f, Violin plots of velocity estimates for regional domains at E14–E15. g, Bar plot of regional proportions by stage of RG. h,i, Kernel density estimation (KDE) plots of cell distributions along the cell cycle manifold at E10 (h) and E14–15 (i), colored by regional domain. j, Posterior estimate plot of cell cycle speed for RPE1 cells 7 days after CRISPR-induced single-gene knockdowns with Perturb-seq62, stratified by NT control (green) and cell cycle knockdown (beige) conditions. Manifold learning was performed using either a large (top) or small (bottom) gene set. k, Kernel density plot of continuous phase distributions for NT and cell cycle knockdown (CC-KD) samples from j. l, Schematic of the employed transfer-learning approach. Gene harmonic coefficients are obtained on NT controls (many cells) and applied to assign phases in specific gene knockdown conditions with few or unequally distributed cells. m, Scatterplot of velocity learning posterior estimates and s.d. for 986 individual gene knockdown (Δ) conditions in 167,119 RPE1 cells. Vertical lines correspond to mean velocity estimates for NT (green), cell cycle marker (tan) and other (blue) gene knockdowns. n, KDE (top) and binned unspliced–spliced delay (bottom) plots for NT, MCM6Δ and DBR1Δ conditions. The dark green line represents the mean delay; the light green line represents the s.d. o, Scatterplot of scaled cell cycle velocity estimates obtained for conditions in m using small and large gene sets. p, Scatterplot of total number of cells per condition and posterior velocity s.d. for conditions in m. In a,b and j, black dashed lines represent mean estimates over 500 posterior predictions; bars represent credibility intervals (5th to 95th percentile). In d and f, black lines indicate means over 500 posterior predictions. In o and p, Pearson’s correlation coefficient is indicated in red.

