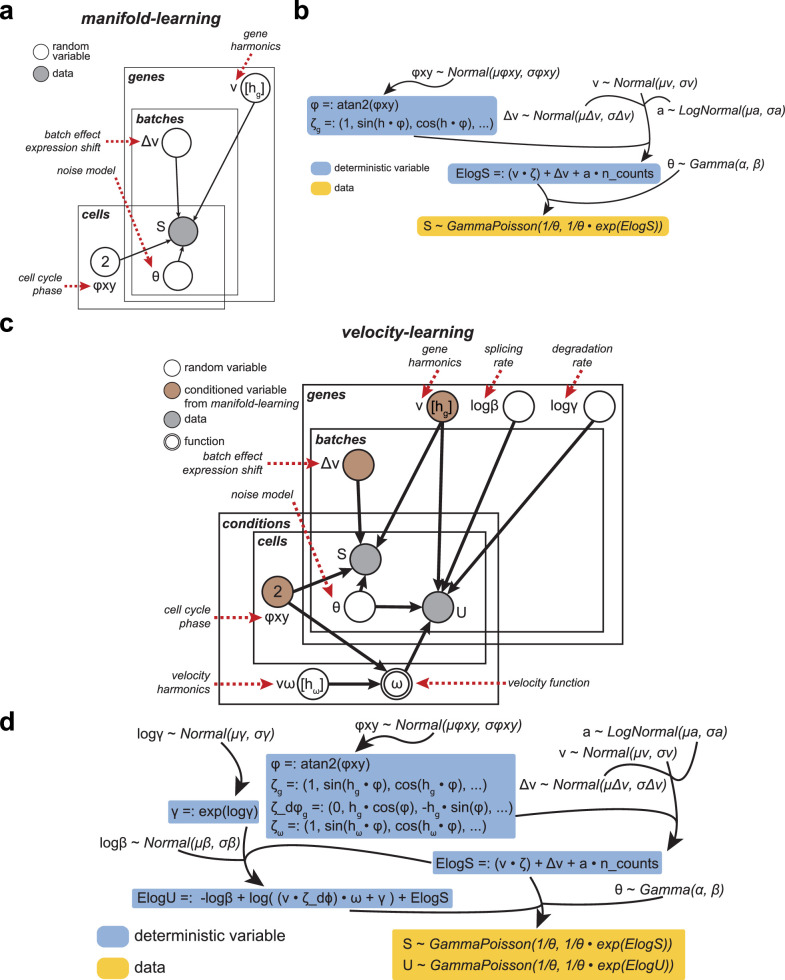
Extended Data Fig. 1. Plate notation diagram and mathematical formulation of VeloCycle.
(a) Plate diagram of the manifold learning procedure. The model assigns each cell to a phase along the cell cycle (φ) and fits a set of Fourier series coefficients (ν) for each gene. (b) Mathematical representation of manifold learning shown in (a). Raw spliced counts (S) are defined as the expectation (ElogS) plus noise, modeled after a negative binomial distribution. (c) Plate notation diagram of the complete velocity learning procedure. (d) Mathematical representation of velocity learning shown in (c). In (a) and (c), nodes indicate a variable (white: random variable; gray: observed data; brown: conditioned variable from manifold learning) and arrows indicate dependency. Plates (genes, cells, conditions, and batches) signal independence and contain variables with the same dimensions. In (b) and (d), blue-boxed variables are deterministic and computed from latent variables; yellow-boxed variables are conditioned on observed data.

