
FIGURE 4.
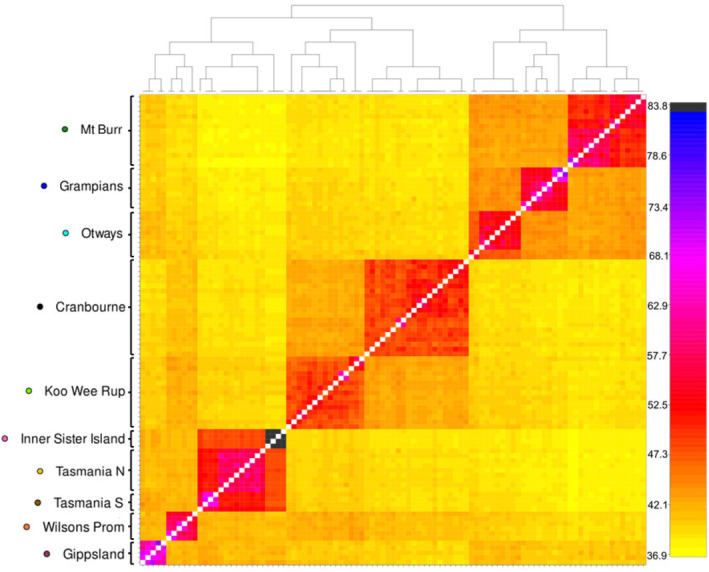
Heatmap of individual pairwise coancestry coefficients generated by fineRADstructure in a reduced dataset of 113 Isoodon obesulus. Cells indicate degree of pairwise haplotype similarity between individuals and are shaded from yellow (low) to blue (high) to indicate increasing levels of coancestry. Above, a dendrogram of individual clustering based on coancestry coefficients with posterior probability on arms, all arms > 0.87. Left, a priori population assignments indicating group assignment of individuals; no individuals were sorted outside of their a priori population. Analysis with all individuals available in Figure S3.