
FIGURE 5.
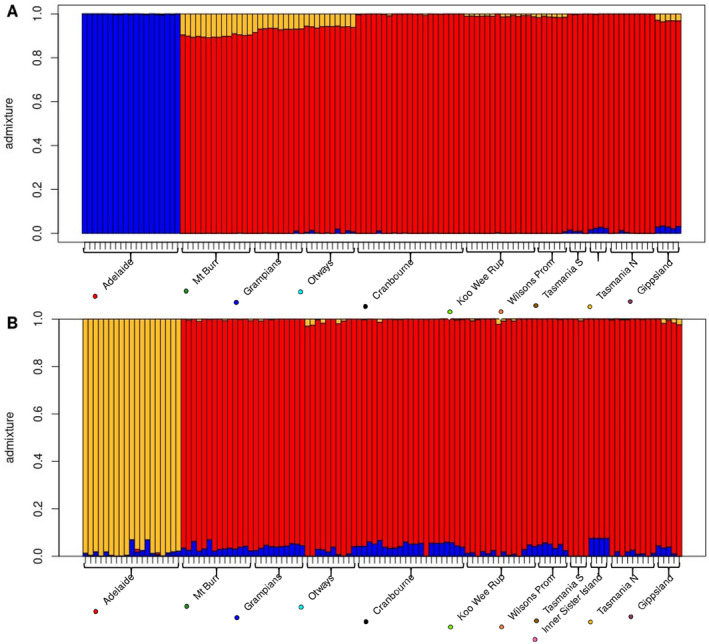
Admixture barplots of conStruct non‐spatial (A) and spatial (B) models of genetic clustering in 116 Isoodon obesulus in southeast Australia. Samples sorted by longitude from left (west) to right (east). The Mt. Rothwell population is not included, as animals at this location are known to be translocated.