
FIGURE 7.
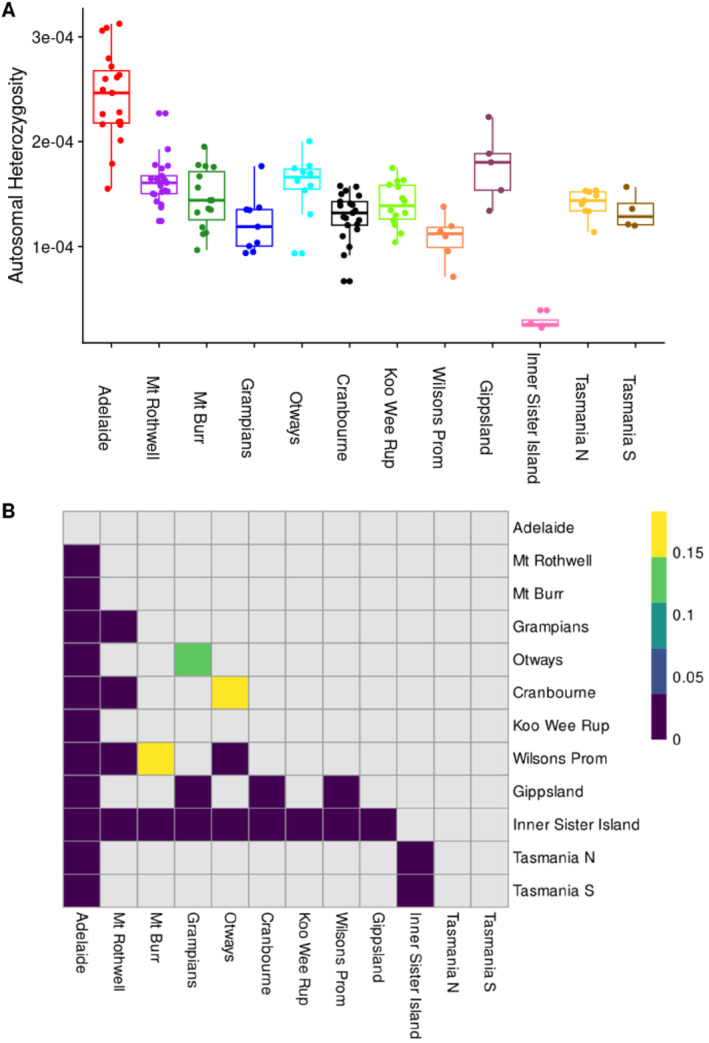
(A) Individual autosomal heterozygosity for 137 Isoodon obesulus in south‐eastern Australia. (B) Heatmap of statistically significant pairwise comparisons, as indicated by ANOVA and Tukey's HSD (Table S2). Darkest shading indicates p < 0.1 after adjustment for multiple comparisons.