
FIGURE 9.
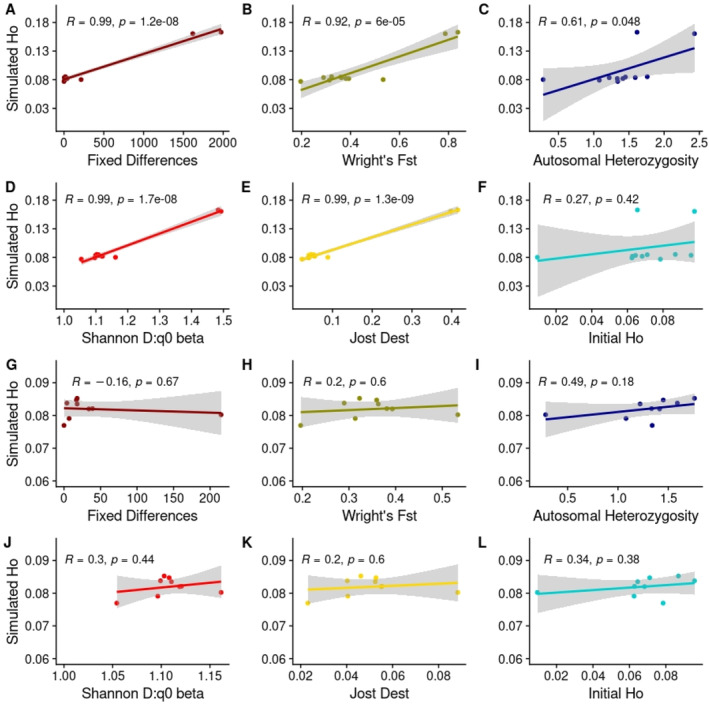
Correlations between final simulated observed heterozygosity (simulated Ho) and six genetic diversity metrics in the full dataset (A–F) and reduced dataset (G–L). Pearson correlation coefficients (R) and p‐values (p) superimposed.
Official websites use .gov
A
.gov website belongs to an official
government organization in the United States.
Secure .gov websites use HTTPS
A lock (
) or https:// means you've safely
connected to the .gov website. Share sensitive
information only on official, secure websites.
Correlations between final simulated observed heterozygosity (simulated Ho) and six genetic diversity metrics in the full dataset (A–F) and reduced dataset (G–L). Pearson correlation coefficients (R) and p‐values (p) superimposed.