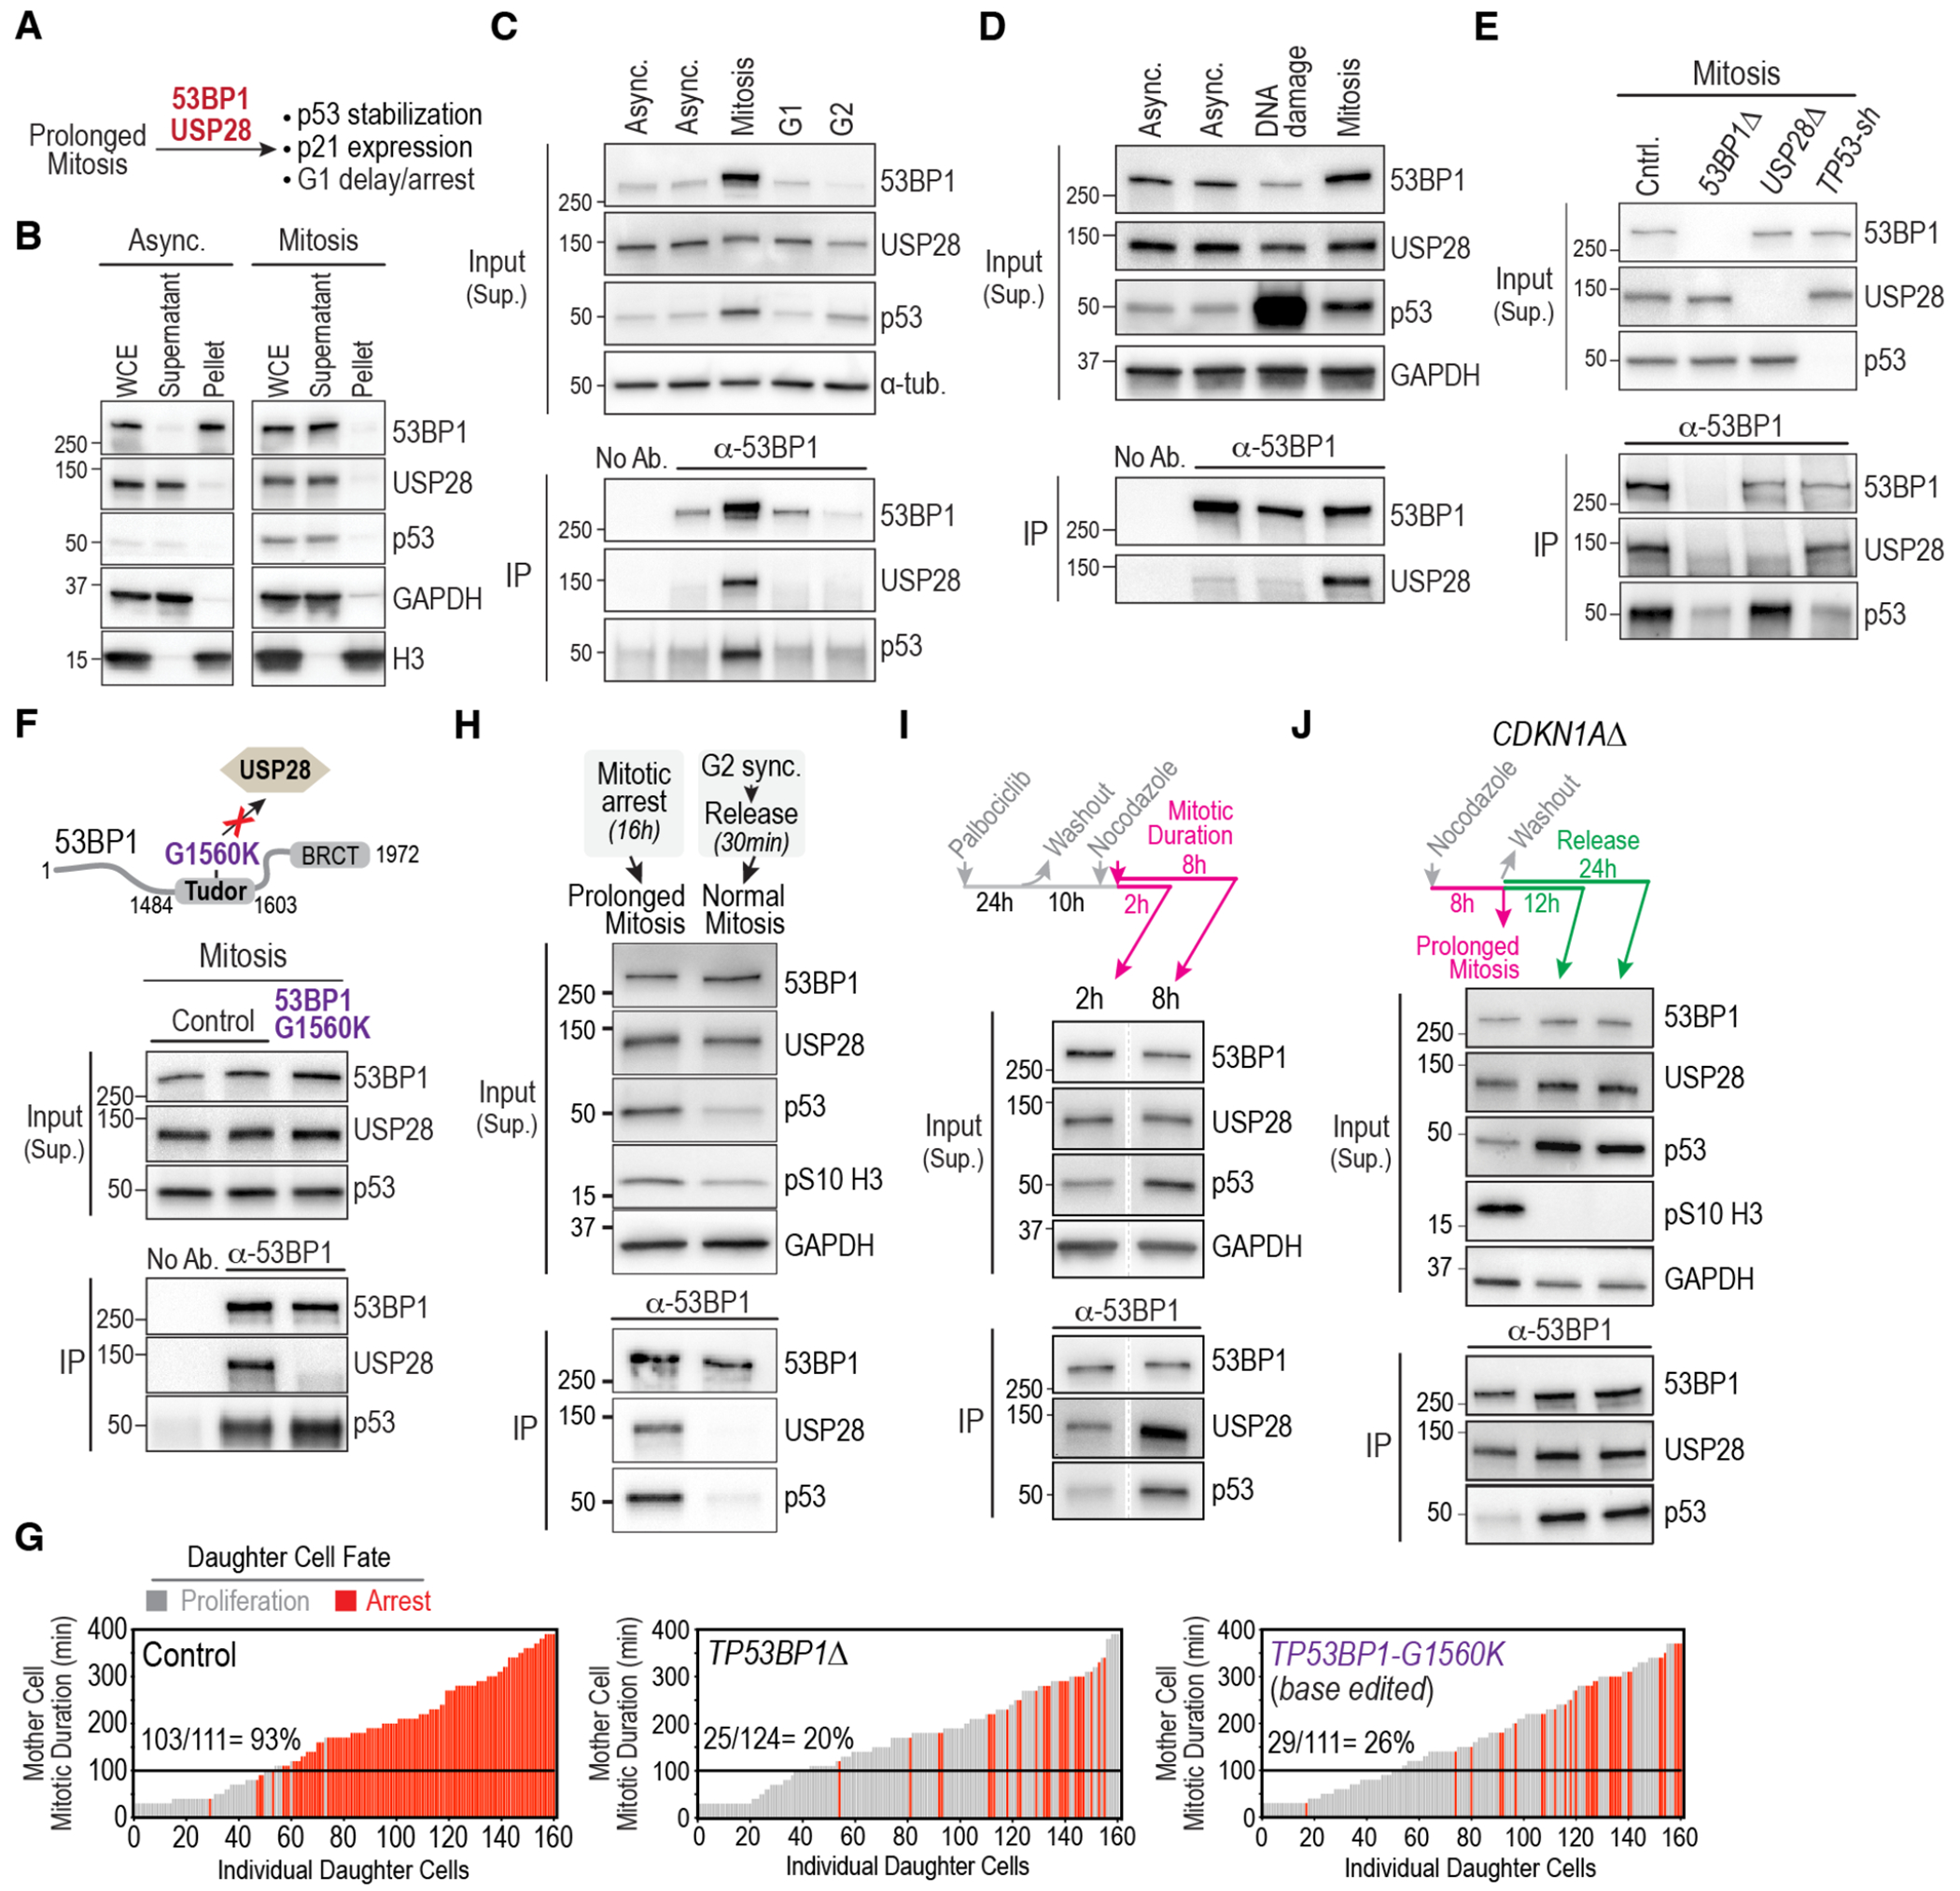
Fig. 2. Mitosis-specific formation of stopwatch complexes transmits memory of extended mitotic duration to daughter cells.

(A) Schematic highlighting the requirement for 53BP1 and USP28 for mitotic stopwatch function. (B) Immunoblots monitoring solubility of 53BP1 and USP28 in asynchronous and mitotic cell extracts. WCE: Whole Cell Extract. GAPDH and histone H3 are soluble and chromatin-bound insoluble controls, respectively. See also Fig. S4A. (C) – (E) Analysis of 53BP1 immunoprecipitates from: (C) Asynchronous cells or cells treated to arrest at indicated cell cycle stages; (D) Asynchronous cells and cells treated to induce DNA damage or prolong mitosis. (E) Cells of the indicated genotypes treated to prolong mitosis. Treatment details are indicated in Fig. S4B. Inputs are soluble supernatants; IP: immunoprecipitate; “No Ab.” is a beads-only control. α-tubulin and GAPDH serve as loading controls. See also Fig. S4C,D. (F) (top) Schematic showing the location of the G1560K point mutation in 53BP1’s Tudor domain that disrupts its interaction with USP28 (24) and was introduced by base editing of the endogenous TP53BP1 locus; see Fig. S4E). (bottom) Analysis of 53BP1 immunoprecipitates from cells treated to prolong mitosis as described in Fig. S4B. (G) Functional analysis of the mitotic stopwatch for the indicated engineered mutant lines. The control graph is the same as in Fig. 1B. (H) Analysis of 53BP1 immunoprecipitates from cells treated to prolong mitosis or following release from synchronization at the G2-M boundary using a CDK1 inhibitor into an unperturbed mitosis. Treatment details outlined in Fig. S5A. Anti-pS10 H3, which monitors mitosis-specific phosphorylation of histone H3 on Ser10, was used as a marker for mitosis and GAPDH served as a loading control. (I) Analysis of 53BP1 immunoprecipitates from synchronized cells held in mitosis for ~2 or ~8h using the protocol schematized on the top. GAPDH serves as a loading control. Lanes shown are from a single exposure of the same immunoblot. See also Fig. S5B. (J) Analysis of the stability of stopwatch complexes following their formation in prolonged mitosis. CDKN1AΔ cells were employed to avoid the G1 arrest observed following release from extended mitosis (Fig. 1B) and were treated as indicated in the schematic above the blot. See also Fig. S5D. 12h and 24h after release from mitosis represents late G1/S and G2 phases of the daughter cells’ cell cycle. GAPDH serves as a loading control. Progression of daughter cells into the next mitosis was confirmed by live imaging (see Fig. S5E).
