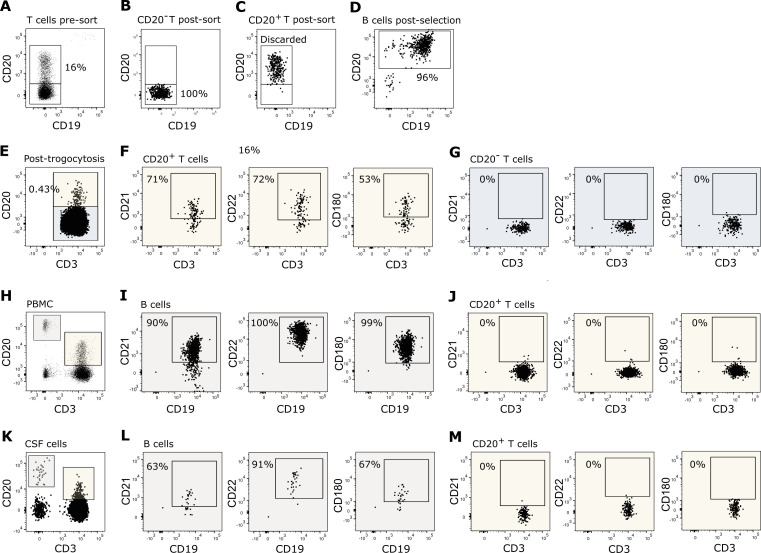
Figure 1.
T cell trogocytosis. (A–D) Flow cytometry dot plot example of purified T and B cells used in the trogocytosis assay. (A) Negatively isolated T cells prior to fluorescence activated cell sorting of (B) CD20− T cells and (C) CD20+ T cells. (D) Negatively isolated B cells. (E–G) Flow cytometry dot plot example of T cells after 1 h of trogocytosis. (E) CD20 transferred to CD20− T cells following trogocytosis. Expression of CD21, CD22 and CD180 on (F) CD20+ T cells and (G) CD20− T cells following trogocytosis. (H–J) Expression of CD21, CD22, and CD180 on (I) B cells and (J) CD20+ T cells in the blood. (K–M) Expression of CD21, CD22, and CD180 on (L) B cells and (M) CD20+ T cells in the CSF.

