Figure 2.
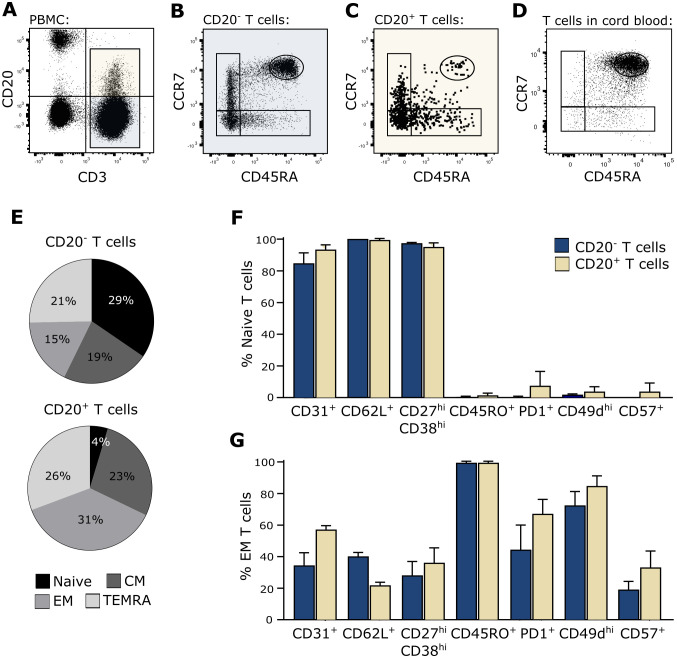
True naïve CD20+ T cells. (A–D) Flow cytometry dot plot example of naïve T-cell identification in blood. The gating strategy include gating of lymphocytes, single cells, live cells, and CD20− and CD20+ T cells as shown in the CD3/CD20-plot in (A). Naïve CD20− T cells (B) and CD20+ T cells (C) in peripheral blood and naïve T cells in cord blood (D) were defined as CD45RA++CCR7++. (E) Distribution of naïve (CD45RA++CCR7++), central memory (CM; CD45RA−CCR7+), effector memory (EM; CD45RA−CCR7−), and terminally differentiated T cells (TEMRA; CD45RA+CCR7−) in the CD20− and CD20+ T population in the blood. (F, G) Staining of various surface markers associated with a naïve or memory phenotype on (F) CD45RA++CCR7++ naïve T cells and (G) CD45RA−CCR7− effector memory T cells from three healthy donors. Mean + SD is shown.

