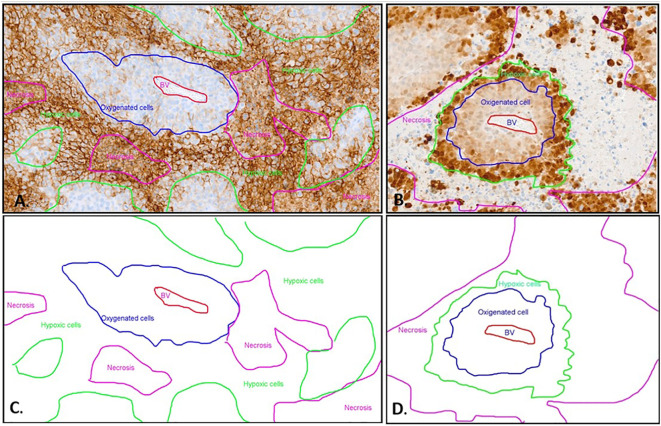
Figure 2.
Immunohistochemistry with CA IX (A) and Pimonidazole (B) staining and schematic representation (C, D) of different oxygenated cells in relation to the blood vessel. (A) The CA IX-positive cells exhibit distinct membrane staining. The non-hypoxic tumor cells (blue line) are identified around a central blood vessel (BV, red marking). The majority of positive hypoxic cells (green line) are detected as palisade formations around the necrotic areas (pink line). However, in the CA IX staining, the necrosis also displays non-specific diffuse staining that is not associated with the membrane. This non-membrane-specific staining allows differentiation between the necrotic areas and the hypoxic cells. (B) The MAb1 immunohistochemistry displays a distinct hypoxic pattern. The non-hypoxic tumor cells (blue line) are identified around a central blood vessel (BV, red marking). Further away from the center of the blood vessel, the hypoxic tumor cells (green line) exhibit strong nuclear and cytoplasmic staining, forming a palisade between the oxygen-rich tumor cells and the necrosis (pink line). The necrosis shows no Pimonidazole (MAb1) staining. (C) Schematic depiction of distinct oxygenated cell distributions relative to the blood vessel in CAIX immunohistochemistry, using the same sample as presented in image A. (D) Schematic distribution of oxygenated cells in relation to the blood vessel in pimonidazole immunohistochemistry, employing the identical sample displayed in image B.

