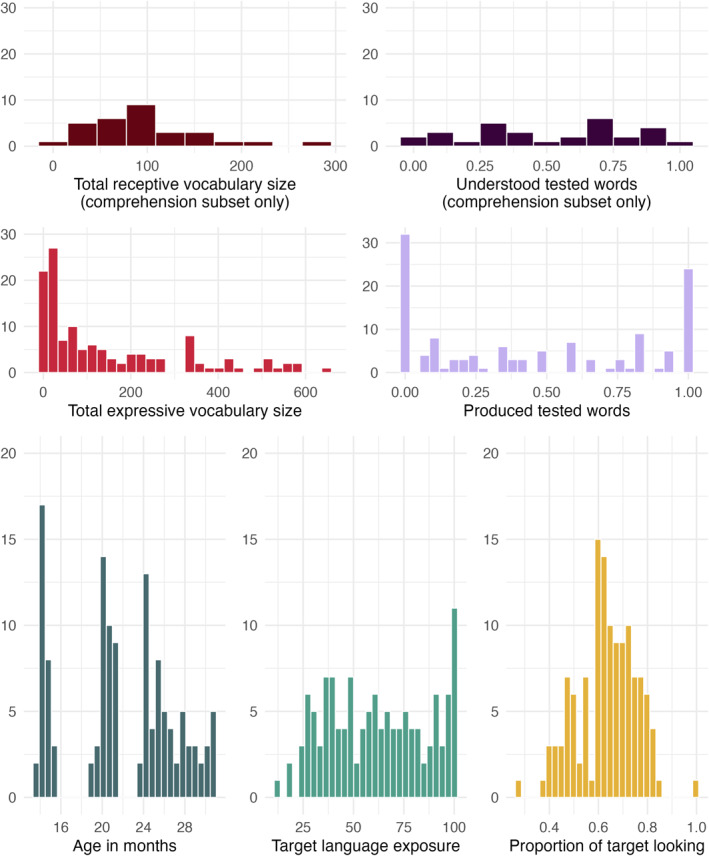
FIGURE 1.

Histograms of predictor and outcome variables. Histograms illustrate the distribution of our predictor and dependent variables across the subsample and the full sample, with counts on the y‐axis. For the subsample of 14‐month‐olds with comprehension data, their total receptive vocabulary size and the proportion of tested words reported to be understood (labeled “understood tested words”) on the CDI are shown on the top. All other figures correspond to the full production sample which includes all 126 children tested. Their displayed data encompasses children's total expressive vocabulary size, the proportion of tested words that children were reported to produce on the CDI (labeled “produced tested words”), children's age in months, children's language exposure to the tested language, and children's mean proportion of target looking on the looking‐while‐listening task.
