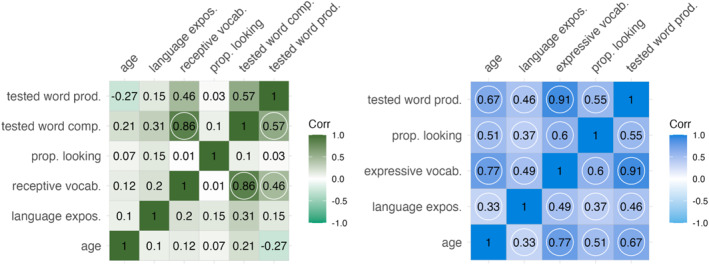
FIGURE 2.

Child‐level correlation plot of predictor and outcome variables. Child‐level Spearman correlation matrix for the subsample with comprehension data (left) and the full sample with production data (right). For the comprehension subsample, all statistically significant correlation coefficients are circled in the lower triangular part of the correlation matrix. Correlations that are still significant after correcting for multiple comparisons are circled in the upper triangular part of the correlation matrix. For production (right), all correlations are circled because they were statistically significant both before and after correcting for multiple comparisons. Darker shading indicates stronger correlation. “Tested word comp.” and “tested word prod.” refer to on average, how many of the tested words children were reported to understand or produce on the CDI. “Prop. looking” refers to children's average proportion of target looks on the looking‐while‐listening task. “Receptive vocab.” and “Expressive vocab.” refer to children's total receptive or productive vocabulary size as captured on the CDI, excluding the tested items. “Language expos.” refers to children's exposure to the tested language as a percentage of total language exposure. “Age” refers to children's chronological age (in days for comprehension given the tight age range and in months for production).
