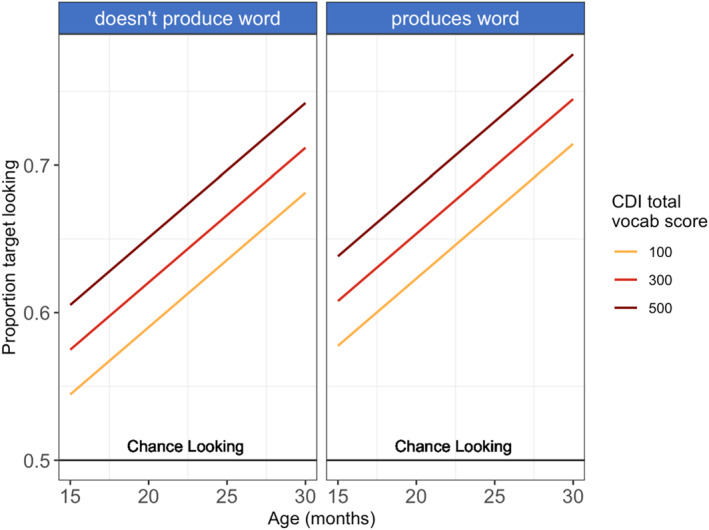
FIGURE 4.

Model‐predicted values of looking accuracy (proportion target looking) by age and total vocabulary, split by whether or not the child was reported to produce the target word. Predicted values of proportion target looks (y‐axis) from the best‐fitting model are shown, which included produces_word + age + vocabulary_size as predictors. On the x‐axis is children's age in months. The colored lines indicate total productive vocabulary size bins depicting a range from 100 to 500 words. Figure is faceted by reported production of the target word, although this predictor was not significant in the model.
