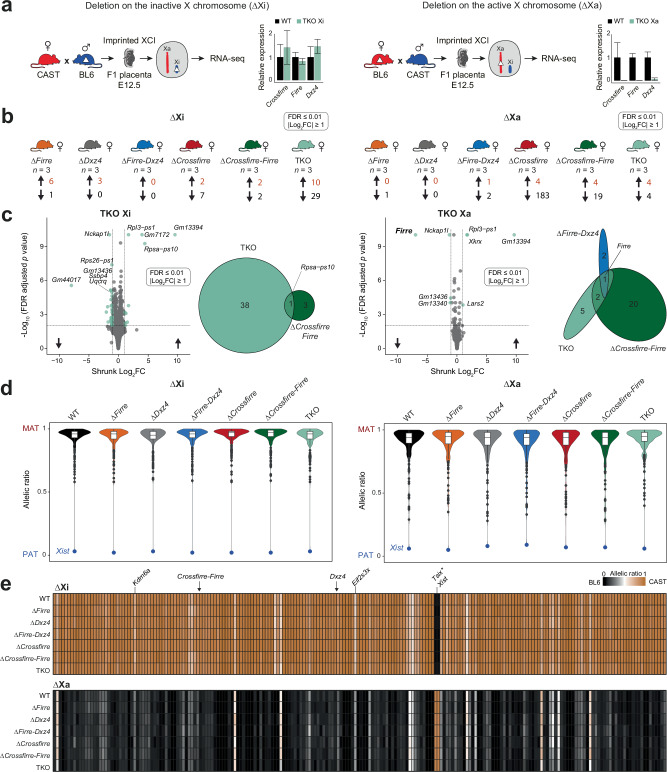
Fig. 3. Deleting the imprinted Crossfirre locus alone or together with Firre and Dxz4 does not affect imprinted XCI.
a Schematic of our experimental system to investigate the impact of the deletions on the inactive X (Xi, left) or active X (Xa, right) for imprinted X inactivation. RNA-seq data of E12.5 female placentas are analyzed from wildtype (WT) F1 reciprocal crosses (CASTxBL6 n = 9, BL6xCAST n = 8), and for the six F1 mutants carrying the deletion on the paternal Xi (n = 3 per genotype) or on the maternal Xa (n = 3 per genotype). The relative expression (mean and standard deviation) between WT and ∆Crossfirre-Firre-Dxz4 (TKO, turquoise) is shown for deletions on Xi (left) and Xa (right). b Number of differentially expressed genes across mutant strains (DEseq2: FDR ≤ 0.01, |log2FC| ≥ 1). c FDR-adjusted P values of differential gene expression analysis between WT and TKO on Xi (left) and Xa (right). Venn diagram showing the overlap of dysregulated genes between ∆Firre-Dxz4 (blue), ∆Crossfirre-Firre (green), and the TKO (turquoise). d Median allelic ratios for X-linked genes in WT (black) and the six knockout strains carrying the deletions on Xi (left) or Xa (right). The blue dot emphasizes the paternal allelic ratio of the lncRNA Xist. The allelic ratios range from 0 to 1 such that 1 corresponds to maternal expression (MAT), 0.5 to biallelic expression, and 0 to paternal expression (PAT). Boxes indicate the interquartile range around the median and whiskers 1.5x the interquartile range. e Heatmap showing median allelic ratios for X-linked genes that are informative across all WT and knockout strains carrying the deletions on Xi (upper panel) or Xa (lower panel). Brown indicates an allelic ratio of 1 (CAST allele), while black indicates an allelic ratio of 0 (BL6 allele). Common escape genes Kdm6a and Eif2s3x are highlighted showing biallelic expression, thus validating our approach. Arrows indicate the approximate location of Crossfirre, Firre, and Dxz4. *The expression of Tsix from Xi is due to the overlapping nature with Xist and thus an artifact of the non-stranded analysis.

