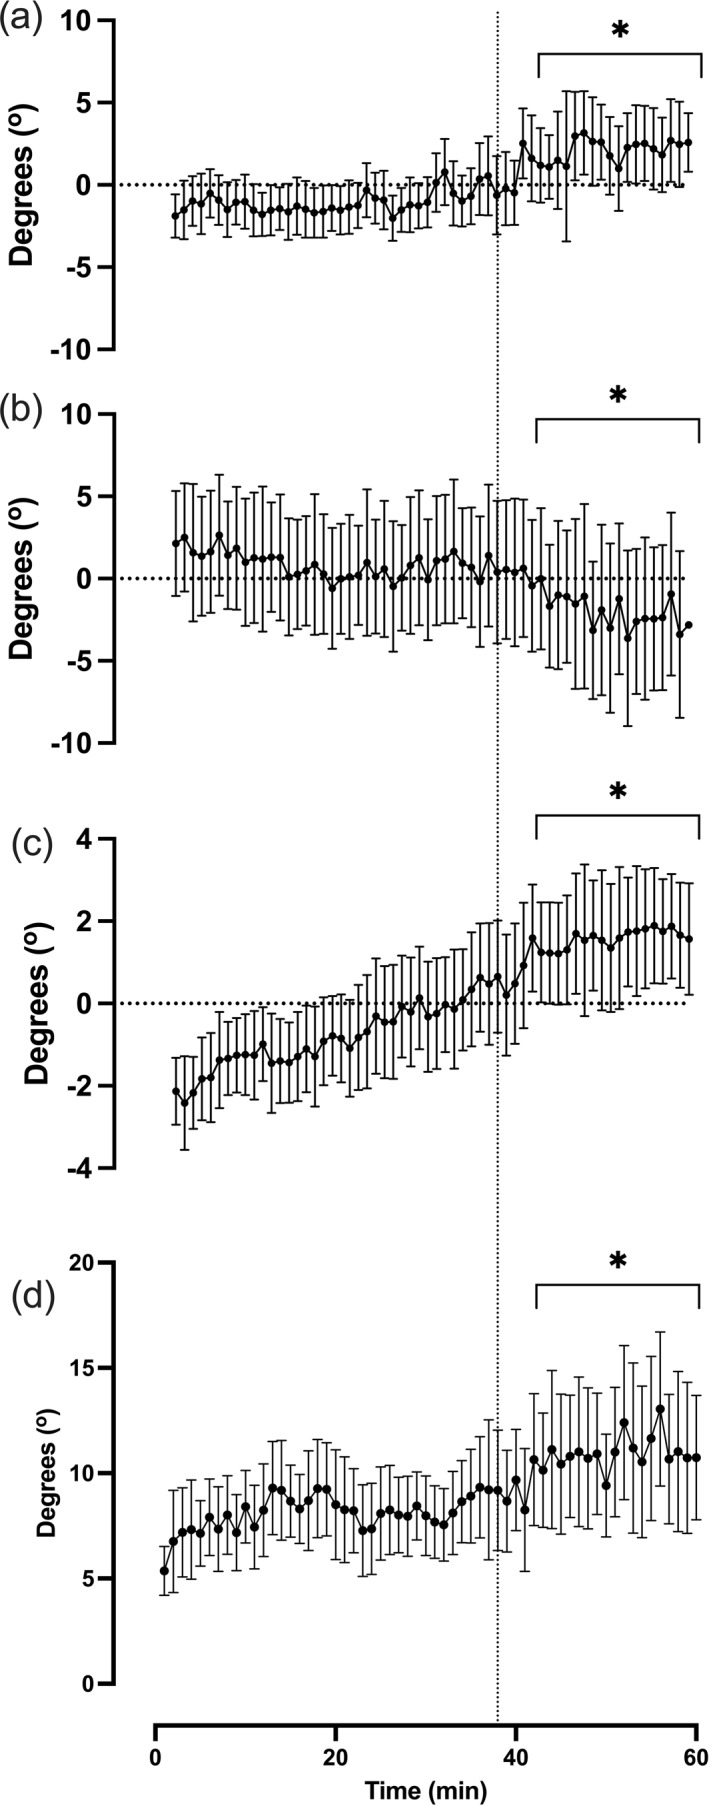
FIGURE 3.

Aerodynamic characteristics throughout the hour record simulation. (A) Foot segment range, (B) foot segment range during the first 90° ([Q1]) of the pedalling cycle, (C) thigh segment range, (D) leg smoothness. Dotted vertical line denotes the point of task failure; * denotes a significant difference between post‐task failure compared to pre‐task failure periods. All data are presented as mean ± SD.
