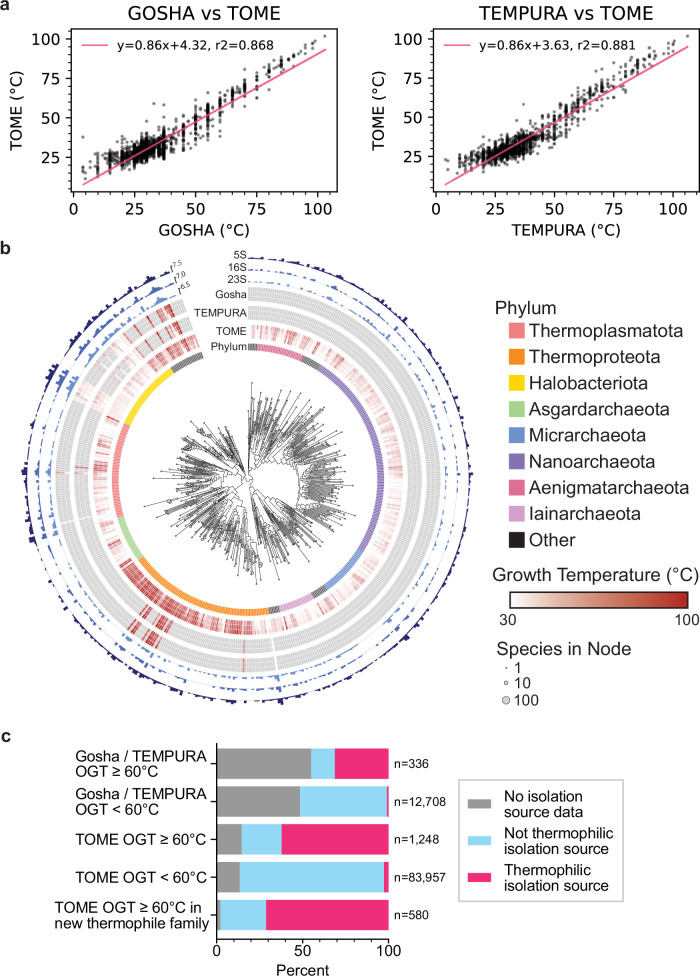
Fig. 2. Optimal growth temperatures of GTDB reference organisms.
a Correlation of TOME-predicted and experimental OGTs from Gosha and TEMPURA, excluding species from TOME’s training set (n = 3346 and 7404 species, respectively). b Archaeal phylogenetic tree of GTDB reference organisms, grouped at the Family taxonomic rank, arbitrarily rooted. A similar tree for bacteria is in Supplementary Fig. 2. Node tip sizes are proportional to the number of species represented by node (log2 transformed). Inner circle indicates Phylum. The next circle represents TOME-predicted min, median, and maximal optimal growth temperatures of all species within rank. The next two circles similarly represent empirically measured optimal growth temperatures pulled from the TEMPURA and Gosha datasets, respectively. Outer circles represent the total number of 23S, 16S, and 5S detected in each rank, respectively (log2 transformed). c Thermal isolation sources for GTDB bacterial and archaeal species (manually classified from GTDB metadata) comparing species with hyperthermophilic OGTs (> = 60 °C) in the Gosha / TEMPURA databases, TOME hyperthermophiles, and non-hyperthermophiles. The bottom bar corroborates TOME hyperthermophiles (n = 580) with no close hyperthermophilic relatives in Gosha / TEMPURA (family-level).

