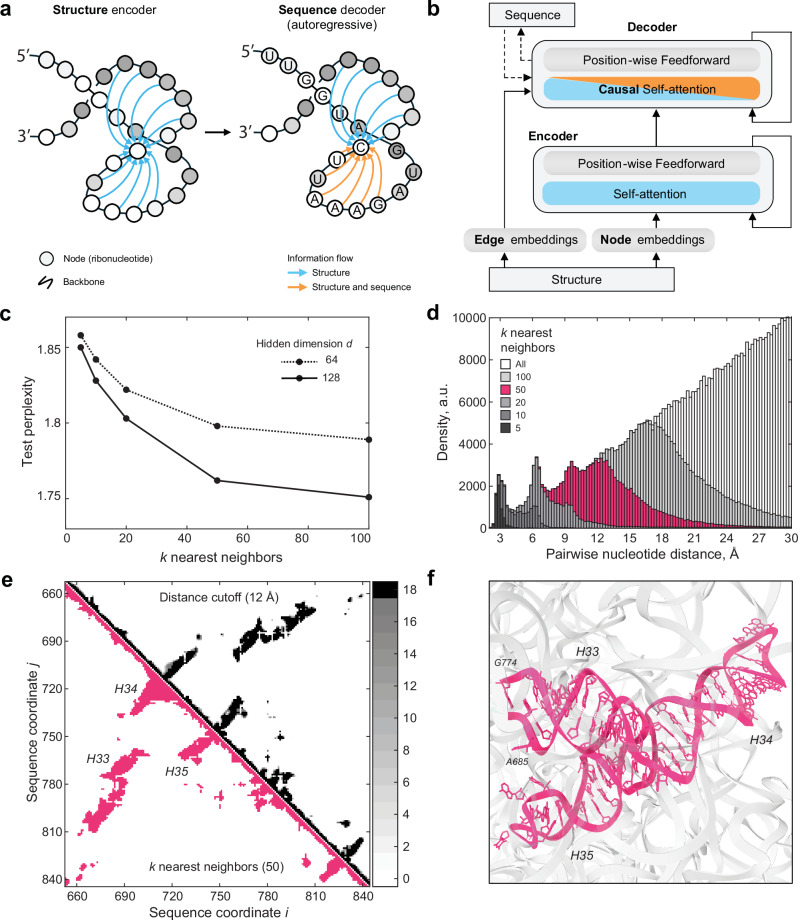
Fig. 3. A 23S rRNA generative model using GTDB sequences and large ribosomal subunit structures.
a Graph Neural Network (GNN) model schematic. b GNN model architecture. Panels (a) and (b) are adapted from Ingraham et al41. to illustrate their use for RNA. For detailed model parameters and training data statistics refer to Supplementary Data 3. c Test perplexity of the GNN models plotted as a function of k-nearest neighbors, highlighting that the model does not significantly improve for k values greater than 50. The final perplexity of the model with hidden dimensions d = 128, and k = 50 was 1.751. d Histogram of inter-nucleotide distances sampled by selecting k nearest neighbors in the distance matrix for E.coli 23S rRNA structure (PDB ID: 7K00)42. Choosing k = 50 covers all distances less than 12 Å. e Comparison of the contact maps generated from the distance matrices, based either on the distance cutoff or the k nearest-neighbors criteria (see Methods). Top-right, the sum of the contact maps for 18 bacterial and archaeal ribosomal RNA structures, projected onto the MSA sequence alignment, and based on the 12 Å distance cutoff criterion. The number of contact maps that align for a given pair of nucleotides is color-coded in the color bar on the right. Bottom-left, contact map for E. coli 23S rRNA, based on selecting k = 50 nearest neighbors to each nucleotide. The two types of contact maps show high similarity. f Structure of the three stem-loops highlighted in (e). A 12 Å inter-helical packing contact is shown with a dashed line in (f), and with an arrow in (e).

