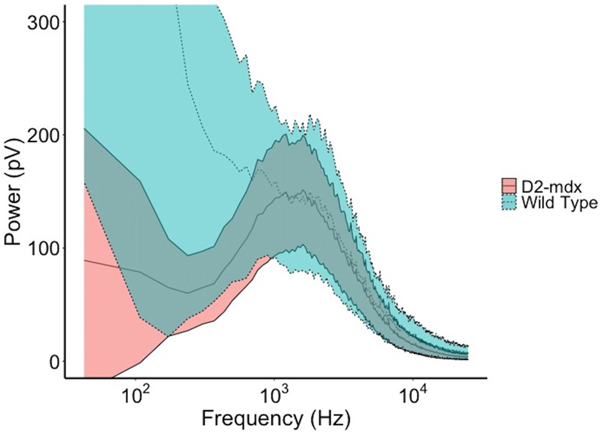
FIGURE 2.
Comparison of EMG power spectrum averaged across all WT and D2-mdx mice. Every segment of 500 frequency sequence were averaged for smoothing. Note shift to right (higher frequencies) apparent in the D2-mdx mice, consistent with myopathic motor units. The inner dashed/solid lines represent the mean activity with the outer limits representing the 95% confidence intervals of the data across the 20 limbs studied.

