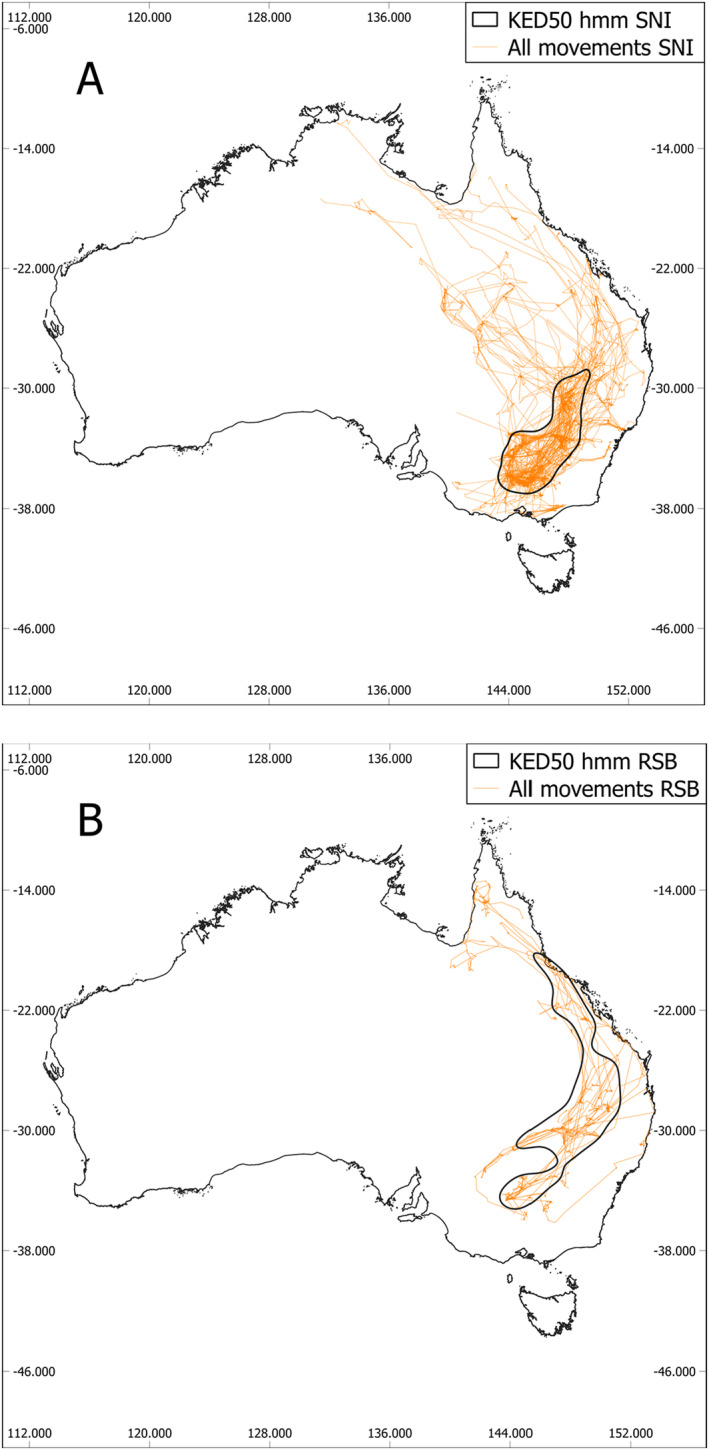
FIGURE 2.

Satellite map of Australia with the 50% contour of the kernel density estimate (KED50) derived from the fourth movement class from a five‐state Hidden Markov Model (straw‐necked ibis; A) and sixth movement class from a six‐state Hidden Markov Model (royal spoonbill; B) with all unclassified movements shown (orange).
