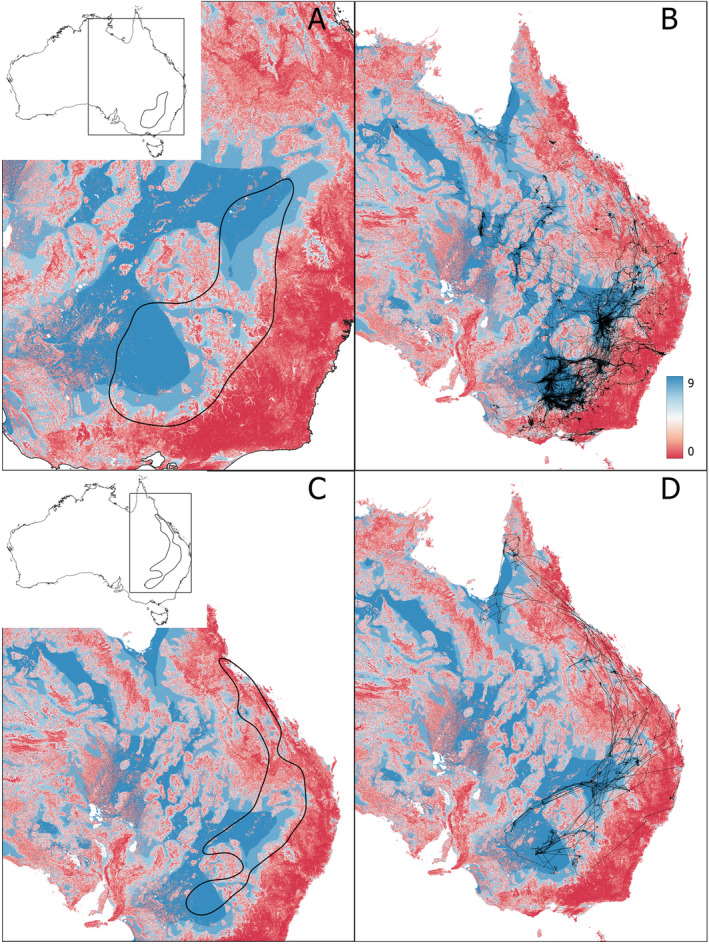
FIGURE 4.

Map of Australia showing the Multiresolution Valley Bottom Flatness index (MrVBF) and (i) the KED50 for straw‐necked ibis (A); (ii) all long‐distance movements of straw‐necked ibis (B); (iii) the KED50 for royal spoonbill (C); and (iv) all long‐distance movements of royal spoonbill (D). Insets show the KED50 and a bounding box of all movements on a map of Australia. MrVBF values are shown on a gradient from lowest (red) to highest (blue); refer to Table S1 for index value interpretation.
