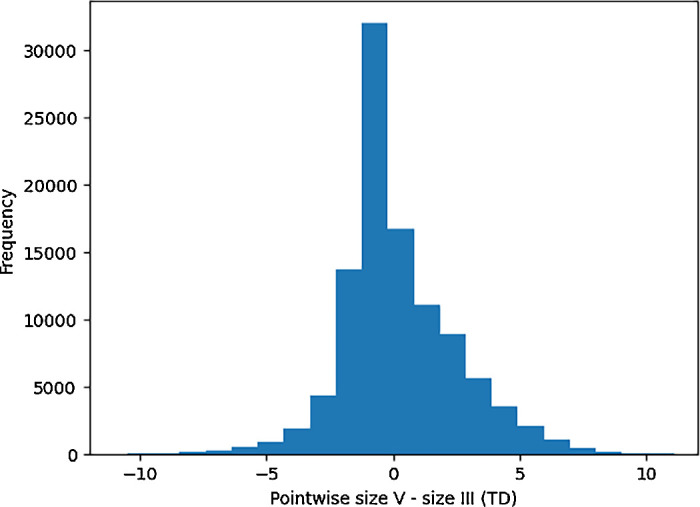
Figure 2.

Pointwise TD differences between size V and size III. Histogram illustrating the distribution of pointwise total deviation differences between stimulus size V and stimulus size III visual fields. The histogram is centered around 0, indicating comparable differences between the two stimuli across the tested points.
