
Figure 3.
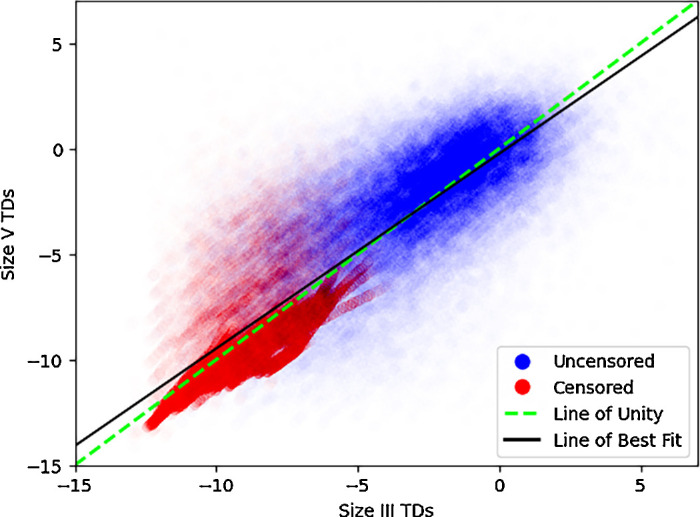
Scatterplot of TD pairs between size III and size V. Pairs of total deviation values from stimulus size III and stimulus size V visual fields for non-arteritic anterior ischemic optic neuropathy and glaucoma. Data points are colored based on whether at least one of the pair is censored. The dotted green line represents the line of unity (y = x). The black line of best fit (y = −0.24 + 0.92 x) demonstrates a substantial linear relationship between the two stimuli (r2 = 0.70). Data points are made transparent for improved visibility and to illustrate relative density.