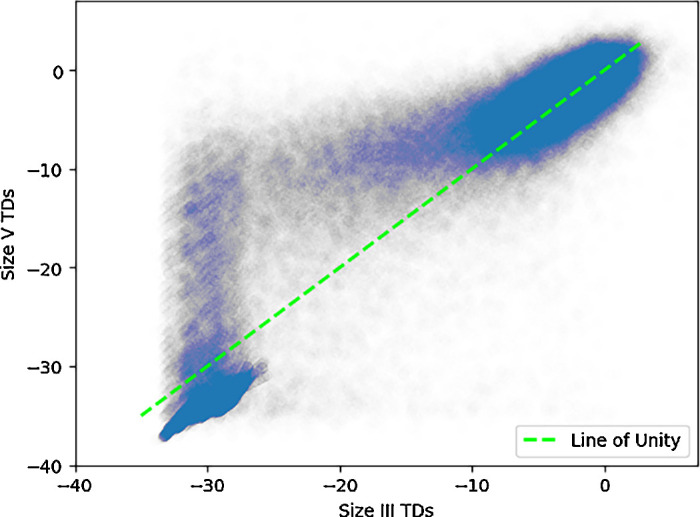
Figure 5.

Scatterplot of uncensored TD pairs between size III and size V. Pairs of uncensored total deviation values from stimulus size III and stimulus size V visual fields for non-arteritic anterior ischemic optic neuropathy and glaucoma. The dotted green line represents the line of unity (y = x). Beyond a certain threshold, points increasingly deviate from the line of unity, highlighting point variability in uncensored measurements. The axes range from −40 dB to 5 dB. Data points are made transparent for improved visibility and to illustrate their relative density. SD of differences between size III and size V pairs across censoring thresholds.
