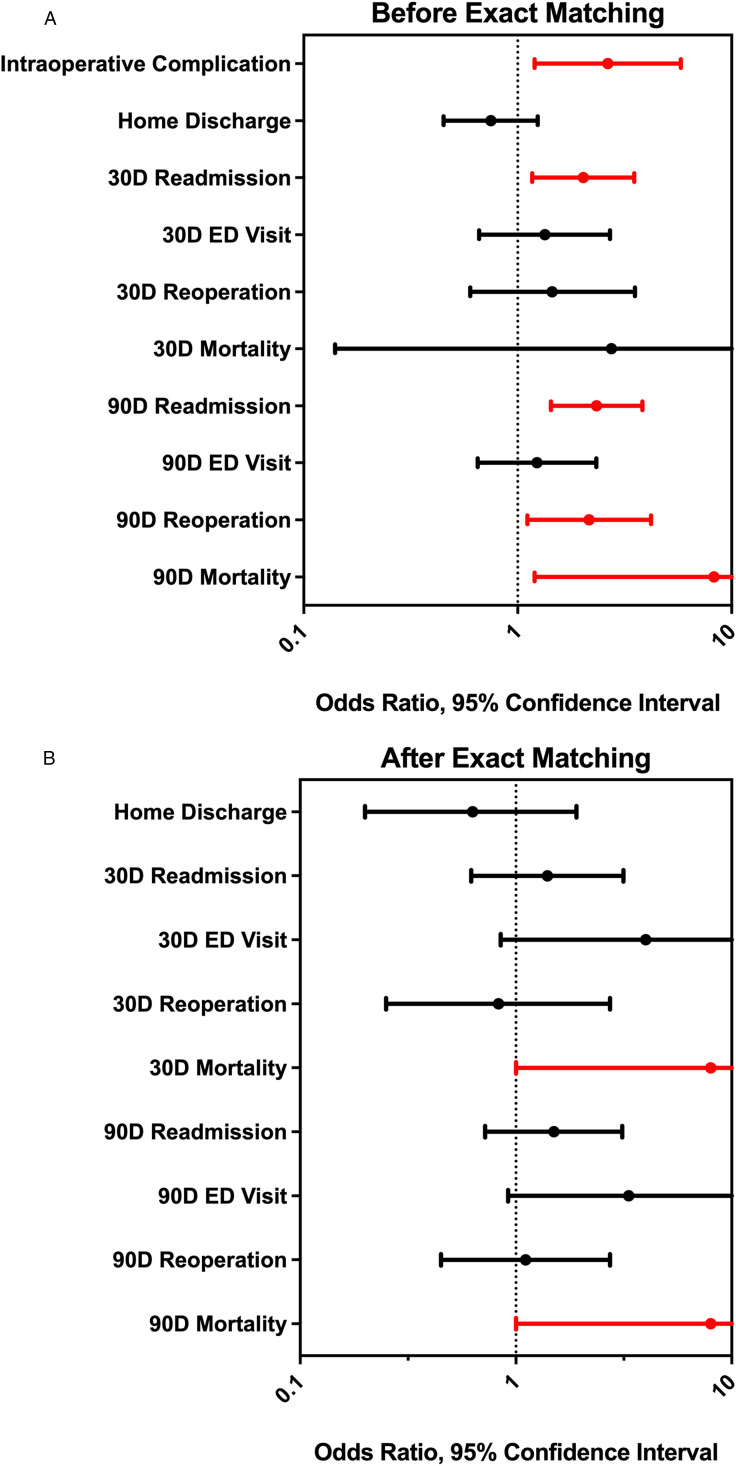
Figure 3.
(A) Forest plot for univariate regression analysis showing odds ratios and 95% confidence intervals for postoperative outcomes. Significant values (P-value <0.05) are denoted in red. (B) Forest plot for coarsened exact matching analysis showing odds ratios and 95% confidence intervals for postoperative outcomes. Significant values (P-value <0.05) are denoted in red.

