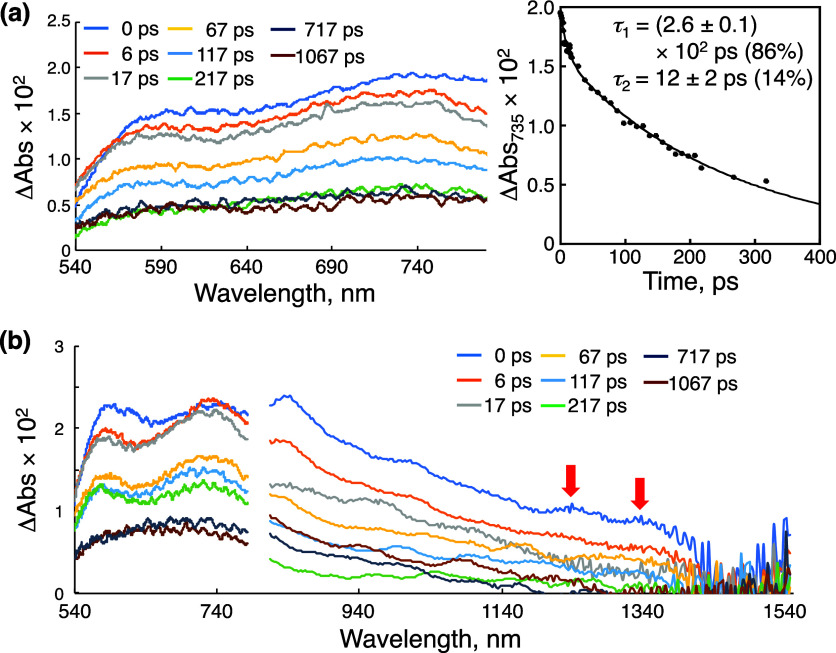
Figure 9.
(a) fs-TAS of 1-H+ in an aqueous solution at pH = 1.3 (λirr = 375 nm) and the decay curve for the transient absorbance of 1-H+ monitored at 675 nm with the double-exponential fitting curve. (b) fs-TAS of 1-H+ in an aqueous solution at pH = 1.3, containing BnOH (100 mM): λirr = 375 nm. The NIR absorption bands derived from [(BnOH)2]•+ are indicated by red arrows.

