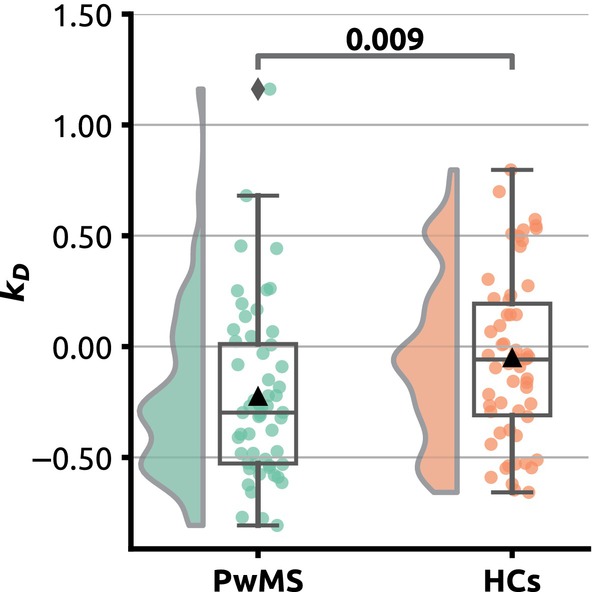
FIGURE 1.

Group differences in degree rank order disruption index (k D). Raincloud plots illustrating individual k D values and distribution. Patients with multiple sclerosis are shown in green, healthy controls in red. Mann–Whitney U test p value is provided in annotation.
