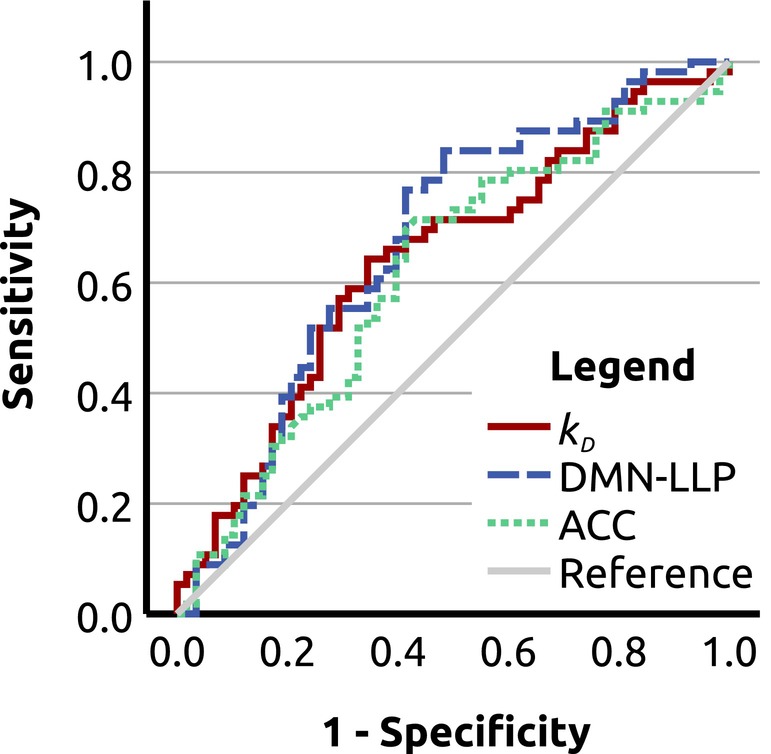
FIGURE 2.

Receiver operating characteristic (ROC) analysis. ROC curves for differentiation between patients with multiple sclerosis and healthy controls using degree rank order disruption index (k D) (area under the curve [AUC] = 0.642; p = 0.007; two‐tailed asymptotic significance for null hypothesis AUC = 0.5, uncorrected); the left lateral parietal portion of the default mode network (DMN‐LLP; AUC = 0.671; p = 0.001) and the anterior cingulate cortex (ACC; AUC = 0.619; p = 0.026).
