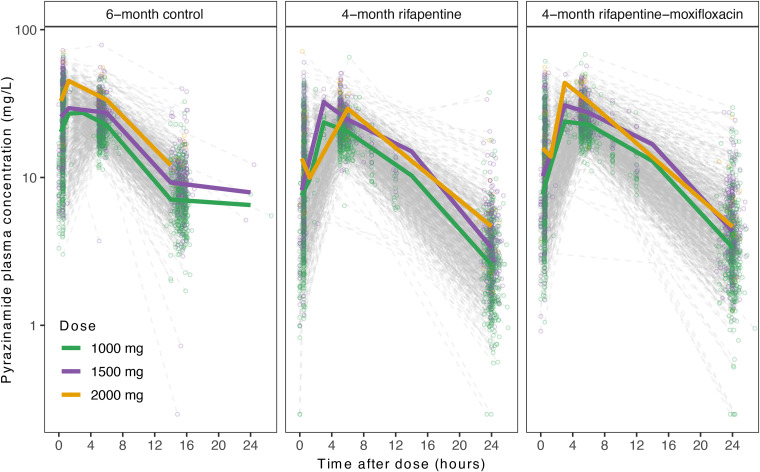
Figure 1.
Observed pyrazinamide plasma concentration with respect to time after dose. Circles represent individual samples, and solid lines represent medians. Data are stratified by treatment regimens (left, 6-month control; middle, 4-month rifapentine-containing regimen; right, 4-month rifapentine–moxifloxacin–containing regimen) and by dose (green, 1,000 mg; purple, 1,500 mg; yellow, 2,000 mg).

