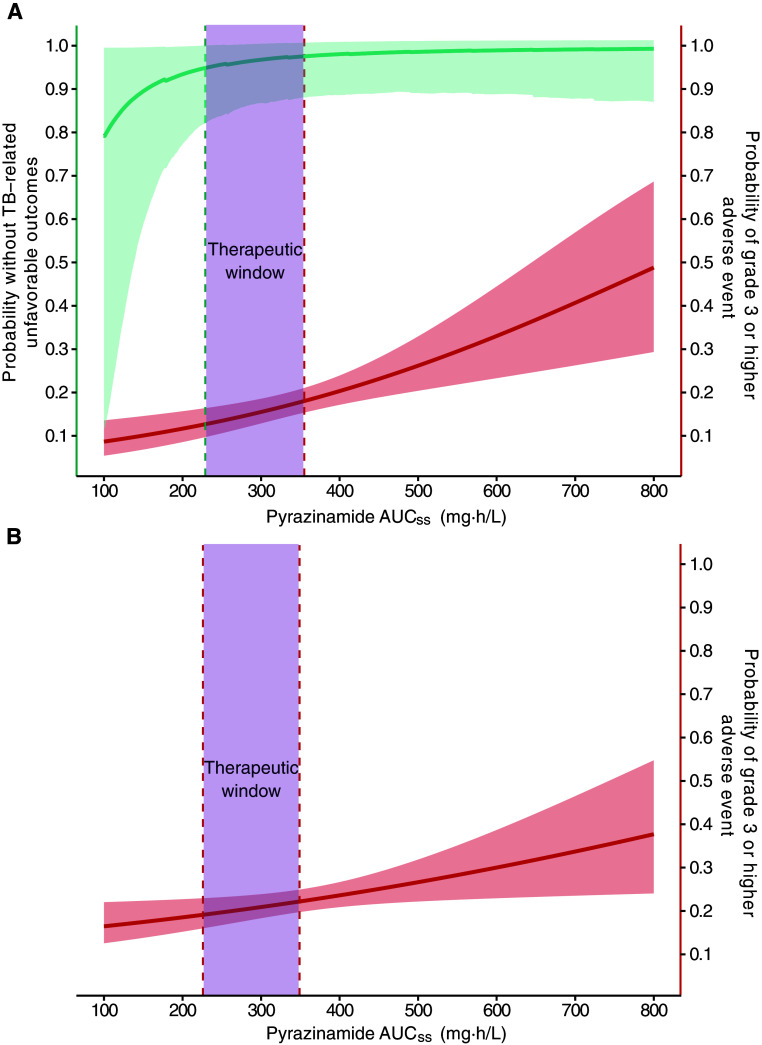
Figure 5.
Pyrazinamide steady-state area under the concentration–time curve (AUCss) associated with primary efficacy and safety outcomes. (A) In the 6-month standard regimen, the therapeutic window of pyrazinamide AUCss between 231 and 355 mg·h/L was associated with ≤18% observed grade 3 or higher adverse event while maintaining 95% durable cure at 12 months after treatment initiation. (B) In the 4-month rifapentine–moxifloxacin regimen, therapeutic window of pyrazinamide AUCss between 226 and 349 was associated with ≤18% observed grade 3 or higher adverse event. The solid teal line indicates the median probability without tuberculosis (TB)–related unfavorable outcomes at given pyrazinamide AUCss, and teal-shaded areas indicate the 95% CI. The solid red lines indicate the median probability of grade 3 or higher adverse event at given pyrazinamide AUCss, and red-shaded areas indicate the 95% CI. A solid teal line with shaded areas is not pictured in B, because pyrazinamide AUCss was not associated with TB-related unfavorable outcomes for the 4-month rifapentine–moxifloxacin regimen. The teal dotted line shows the pyrazinamide AUCss predicted to achieve the targeted primary efficacy outcome threshold. The red dotted line at the upper boundary of the therapeutic window shows the pyrazinamide AUCss predicted to achieve the observed primary safety outcome. The red dotted line at the lower boundary of the therapeutic window in B shows the fifth percentile of the pyrazinamide AUCss used to predict the primary safety outcome. The purple shade shows the therapeutic window constructed on the basis of the exposure and response relationship described above.

