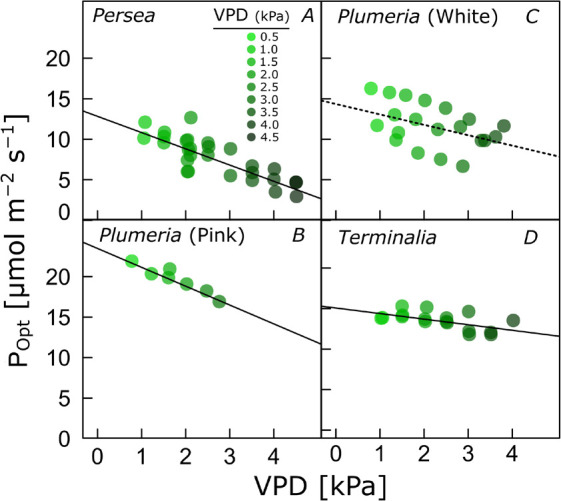
Fig. 2. Photosynthetic CO2 uptake at optimum temperature (Popt) plotted against the vapor pressure deficit (VPD) at which the parameters were determined, for three species, including two varieties of Plumeria rubra, for which leaf-level temperature response curves at different VPD were measured. Solid and dotted lines indicate linear regressions with P<0.05 and P>0.05, respectively.

