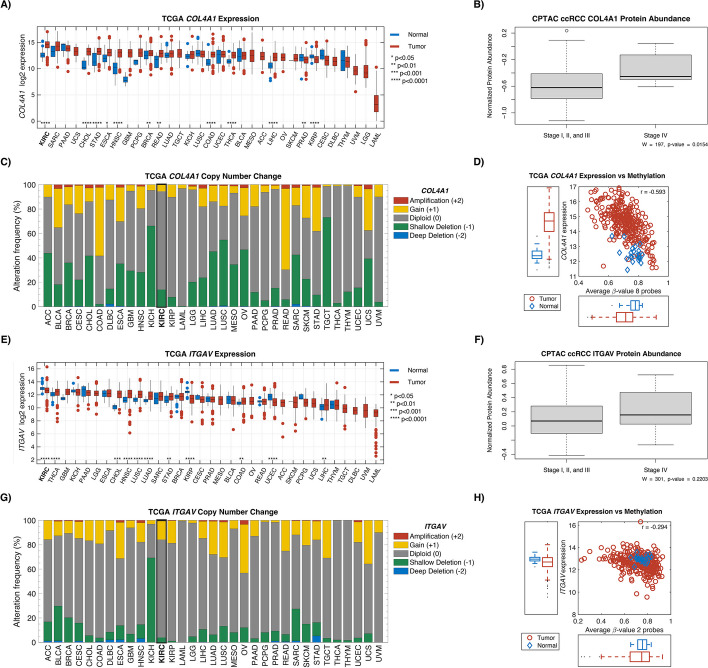
Fig. 7.
Exploration of COL4A1 and ITGAV in TCGA and CPTAC. Gene expression in tumor and normal for COL4A1 (A) and ITGAV (E). Protein abundance between low-stage ccRCC (I, II, and III) and high-stage ccRCC (IV) for COL4A1 (B) and ITGAV (F). C and G show the copy-number change associated with the 2 genes. TCGA gene expression against methylation levels are shown in D and H. Abbreviations: CPTAC, Clinical Proteomic Tumor Analysis Consortium; TGCA, The Cancer Genome Atlas

