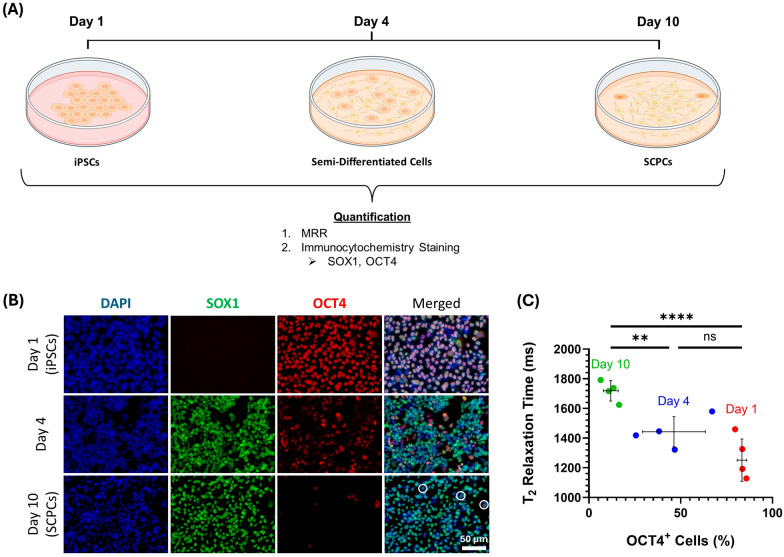
Fig. 3.
T2 value increased as iPSCs differentiated into SCPCs with correspondence to phenotypic changes (SOX1 and OCT4). A Multi-timepoint measurement of T2 values to compare with immunofluorescent staining as iPSCs differentiate to SCPCs across 3 different time points (Day 1, Day 4 and Day 10). B Immunofluorescent staining to illustrate changes in SOX1 and OCT4 phenotypes during the differentiation of iPSCs into SCPCs. DAPI (blue, nuclear), SOX1 (green, neural progenitor marker) and OCT4 (red, pluripotent marker) (Scale bar: 50 µm). B Increase in T2 with decreasing level of OCT4+ cells across a 10-day differentiation period. At least 10 ROIs (more than 60,000 cells) were quantified for each experimental repeat (n = 4). Statistical significance was determined by a Kruskal–Wallis test followed by a Dunn post-hoc test

