. 2024 Dec 6;14(52):38634–38644. doi: 10.1039/d4ra04995k

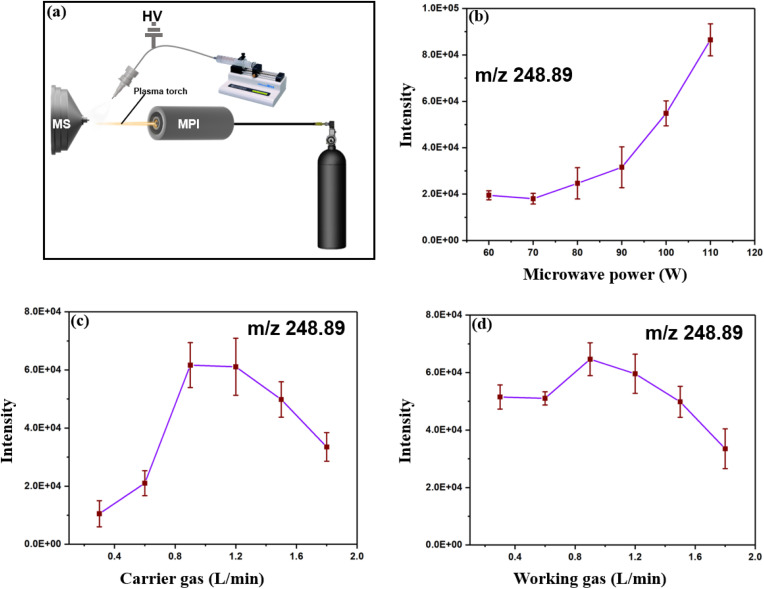
Fig. 3. Optimization of the experimental system parameters. (a) A schematic of the system highlighting the ESI, MPI, syringe pump, and gas cylinder for the carrier and working (b) Influence of microwave plasma power on the intensity of linuron product ions (m/z 248.89), showing a positive correlation between power and ion intensity up to 110 W. (c) Effect of carrier gas flow rate (L min−1) on ion intensity, with optimal ionization observed near 0.8 L min−1. (d) Influence of working gas flow rate (L min−1) on ion intensity, with peak intensity around 0.9 L min−1. Error bars in (b)–(d) represent the standard deviation of intensity measurements at each setting.

Fig. 3