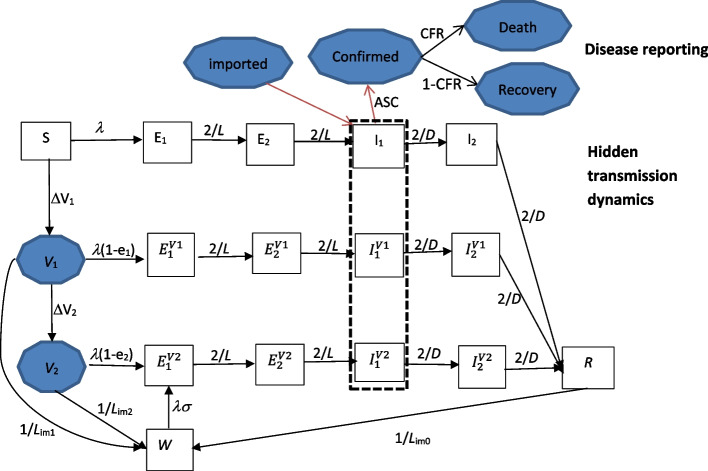
Fig. 2.
The schematic of the transmission model and disease reporting process. The fifteen rectangle boxes represented the hidden transmission processes, and the six shaded circles represented the quantities upon which we made observations, importation, and the numbers of people having had at least one dose of vaccine (V1) and fully vaccinated (V2). Within the transmission model, individuals started as susceptible to infection; under the force of infection λ, they were exposed to SARS-CoV-2. When exposed they became latently infected but not yet infectious; after a latent period of L, they then became infectious, and after an infectious period of D, they recovered and became immune; after an immunity period of Lim0, they transferred to a waned compartment W on which they became partial susceptible to infection. The latent period and infectious period were divided into two equal parts (i.e. E1(t) and E2(t), and I1(t) and I2(t)) respectively to allow their distributions to follow gamma distribution. Susceptible individuals were vaccinated at rate ΔV1 and further fully vaccinated at rate ΔV2; the vaccinated can be either infected as the susceptible but at reduced force of infection; or waned to compartment W. Within the disease reporting process, the infectious individuals were confirmed at a proportion (ASC). A proportion (CFR) of the confirmed died and the rest recovered

