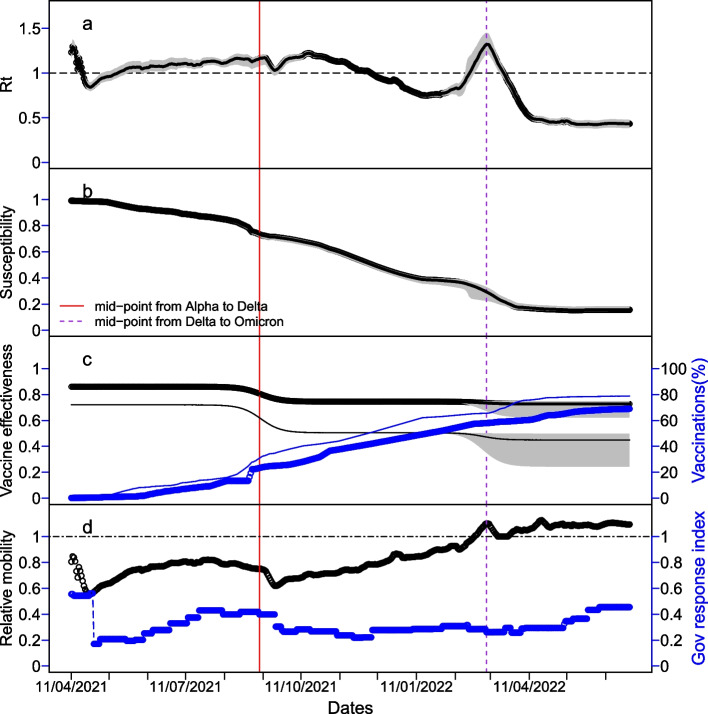
Fig. 4.
The temporal changes of key epidemiological characteristics during the period from 11 April 2021 to 30 June 2022 under the contact model via Google mobility. a time-varying reproduction number (Rt), b susceptibility, c VE and accumulative proportion vaccinated (thin and bold lines represent those having at least one dose of vaccine and those fully vaccinated respectively), d relative contact change recorded in Google mobility data, and relative contact change due to government response Index. The red and purple vertical lines stood for the midpoints of transition from the Alpha to Delta variant and from Delta to Omicron variant of SARS-CoV-2 virus, respectively. In panels a–c, the thick black line represented median estimates and grey shading was their 95% credible intervals

