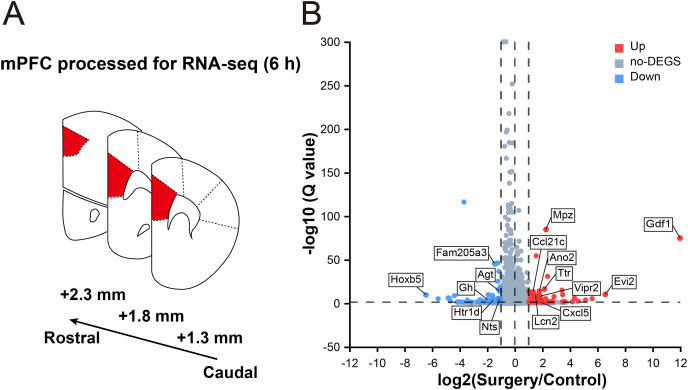
Figure 2. Transcriptomic changes in the mPFC in mice at 6 h after surgery.
(A) Schematic coronal section of rat brain illustrating the mPFC according the rat brain atlas (approximately 2.3–1.3 mm anterior from the bregma). (B) Volcano plot illustrating DEGs between the surgery and control groups. Several main DEGs are annotated. Upregulated genes are labeled in red, downregulated in blue, and the rest in gray. |log2FC| ≥ 1, Q value ≤ 0.05 used as screening threshold, n = 3 mice/group.

