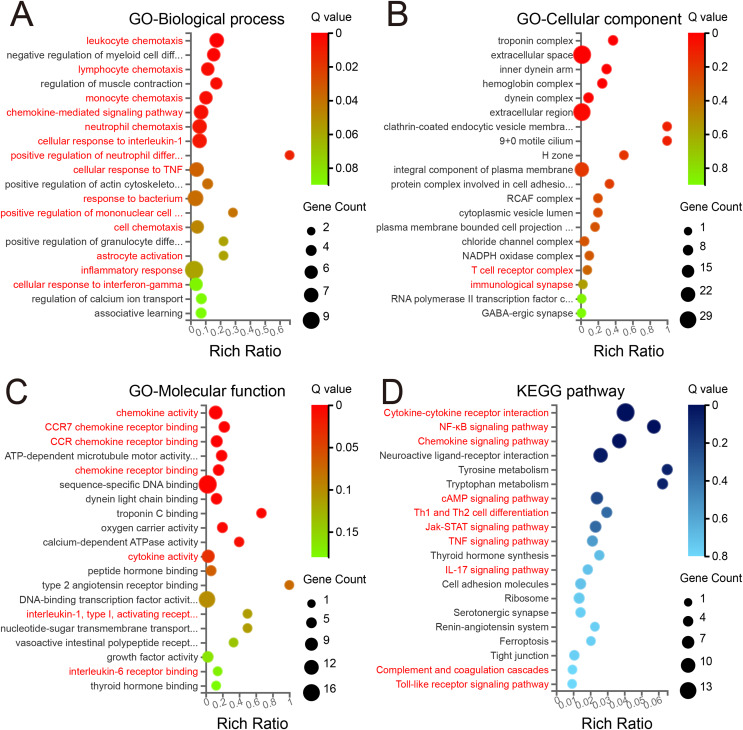
Figure 3. GO and KEGG enrichment analyses of DEGs.
The 20 top enriched GO terms are shown in the biological process (A), cellular component (B), and molecular function (C). (D) The 20 top KEGG pathway enrichments with DEGs. Red text denotes terms related to immunological processes. The ordinate represents the Q value, while the abscissa shows the enrichment ratio. Dot size represents the count of genes, and color indicates the Q value. A Q value ≤ 0.05 was considered significantly enriched.

